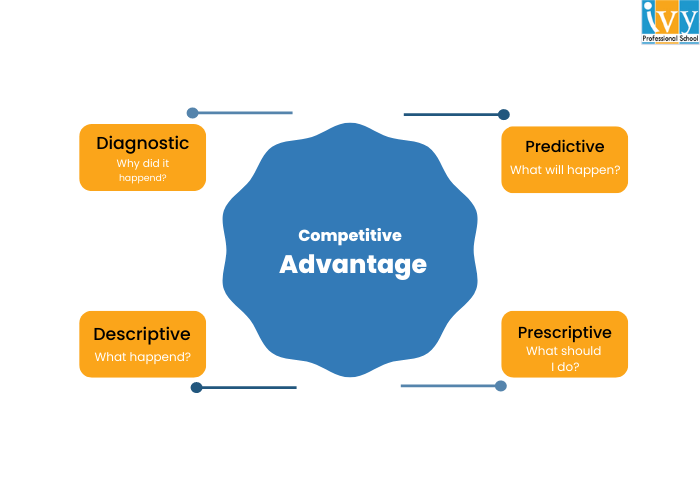
1. Descriptive Analytics: “What Happened?”
Descriptive analytics is the most basic type of data analytics currently used. It analyzes historical data to find out what has happened in the past or what is happening in the present.
It uses various techniques such as data aggregation, data mining, and reporting to spot patterns and trends over time. It may use arithmetic means to show an average of the values or frequency distribution to show how often a value occurs in the dataset.
Descriptive analytics uses visualization techniques like creating charts and graphs to visually represent complex data, making it easy to identify trends.
Examples of Descriptive Analytics
Let’s say you run an online store, and you want to know how much you sold in the last six months. So, you will use descriptive analytics to analyze monthly sales data and find peak sales periods and underperforming months. You can also identify top-selling products.
Similarly, businesses can use descriptive analytics to analyze:
- Financial data to understand profitability.
- Social media engagement data to identify which posts got the maximum likes.
- Customer feedback data to understand customer satisfaction levels.
2. Diagnostic Analytics: “Why did it Happen?”
Diagnostic analytics helps us go further than descriptive analytics. Now that we already know what has happened, diagnostic analytics helps us answer the valuable question, “Why did it happen?” That means we understand the cause of the trends and patterns we just found in the descriptive analytics.
You may use different methods like drill-down analysis, correlation analysis, Pareto analysis, fishbone diagram, hypothesis testing, etc., to effectively understand the cause of an event. This way, businesses can identify areas of improvement and make better strategies.
Examples of Diagnostic Analytics
Let’s say in the above sales report, you found that a particular month had significantly low sales. So, you use diagnostic analysis and find the cause: you had low product stock and couldn’t meet the customer demand effectively.
Similarly, businesses may use diagnostic analytics to find out:
- Why employers are quitting their jobs
- Why customers are leaving them and choosing their competitors
- What causes delays in production, and what are the bottlenecks in the supply chain
When you know the problem and why it’s happening, you will be able to find effective solutions to make things better. Now, let’s move to our third type of data analytics:
Related: Data Scientist vs. Data Analyst
3. Predictive Analytics: “What will Happen?”
Now, we are getting into advanced analysis. Predictive analytics uses historical data, statistical models, and machine learning algorithms to figure out what may happen in the future. It can predict future events, trends, outcomes, and behaviors that may affect the business performance.
Techniques used in this type of data analytics can be time series analysis to identify patterns, regression analysis to identify relationships between variables, or decision trees to represent the decision-making process and predict outcomes. The idea is that once you know what will happen, you can better prepare for the challenges and get ready to take advantage of opportunities.
Examples of Predictive Analytics
Coming back to our online store example, let’s say you found that you had low sales because of an inventory shortage. Now you want to fix this problem. So, you may use predictive analytics to forecast the demand for various products. This way, you can have optimal inventory levels to meet the demand, avoiding inventory shortage as well as overstocking.
Predictive analytics can also be used to:
- Create high-precision weather forecasts
- Select the most talented players and make a strong team
- Predict when a machine needs maintenance to avoid breakdown
- Recommend products to users based on their preferences and past behaviors.
4. Prescriptive Analytics: “How to Make it Happen?”
This is the most advanced type of data analysis that combines descriptive, diagnostic, and predictive analytics. It helps us find out what actions we should take to avoid an undesirable outcome or achieve a desirable outcome.
So, the goal of prescriptive analysis is to provide actionable recommendations. It may use techniques like optimization modeling to find the best solution with given constraints, simulation to evaluate different scenarios, or artificial intelligence techniques to automate decision-making processes.
Examples of Prescriptive Analytics
You used predictive analytics to find the demand forecasts. Now, prescriptive analytics goes further by recommending specific actions to achieve the maximum sales. It suggests how to optimize inventory based on predicted demand, supply chain factors, and business goals. You will also know how much inventory to order and when to order it.
You can also use prescriptive analytics to find actionable insights for these questions:
- What should be the ideal price considering demand, competition, and market conditions?
- Which social media platform is best for your business, and when should you post?
- What adjustments in production processes can minimize waste and increase efficiency?
- What adjustments in the loan portfolio can lower risk while increasing the reward?
Summing Up
Now you know the four types of data analytics and how they depend on each other. The goal of data analytics is to help businesses identify areas for improvement, increase efficiency, and enhance processes. That’s why data analysts are in demand in the current industry.
If you want to be a data analyst, you can join Ivy Professional School’s Data Analytics Certification course. This is a live online program taught by industry professionals from IIT, IIM, and US universities. You will learn to use tools like Excel, SQL, Python, R, and Tableau with 50+ assignments, 30+ case studies, & 10+ industry projects. Visit this course page to learn more about it.