Team Sep 13, 2022 No Comments

Updated in May, 2024
Do you know Netflix and Spotify use the Scikit-learn library for content recommendations?
Scikit-learn is a powerful machine learning library in Python that’s primarily used for predictive analytics tasks such as classification and regression.
If you are a Python programmer or aspiring data scientist, you must master this library in depth. It will help you with projects like building content-based recommendation systems, predicting stock prices, analyzing customer behavior, etc.
In this blog post, we will explain what is Scikit-learn and what it is used for. So, let’s get started…
Scikit-learn is an open-source library in Python that helps us implement machine learning models. This library provides a collection of handy tools like regression and classification to simplify complex machine learning problems.
For programmers, AI professionals, and data scientists, Scikit-learn is a lifesaver. The library has a range of algorithms for different tasks, so you can easily find the right tool for your problem.
Now, there is often a slight confusion between “Sklearn” and “Scikit-learn.” Remember, both terms refer to the same thing: an efficient Python library.
Although Scikit-learn is specifically designed to build machine learning models, it’s not the best choice for tasks like data manipulation, reading, or summary generation.
Scikit-learn is built on the following Python libraries:
Scikit-learn was developed with real-world problems in mind. It’s user-friendly with a simple and intuitive interface. It improves your code quality, making it more robust and optimizing the speed.
Besides, the Scikit-learn community is supportive. With a massive user base and great documentation, you can learn from others and get help when you need it. You can discuss code, ask questions, and collaborate with developers.
Scikit-learn was created by David Cournapeau as a “Google Summer Of Code” project in 2007. It quickly caught the attention of the Python scientific computing community, with others joining to build the framework.
Since it was one of many extensions built on top of the core SciPy library, it was called “scikits.learn.”
Matthieu Brucher joined the project later, and he began to use it as a part of his own thesis work.
Then, in 2010, INRIA stepped in for a major turning point. They took the lead and released the first public version of Scikit-learn.
Since then, its popularity has exploded. A dedicated international community drives its development, with frequent new releases that improve functionality and add cutting-edge algorithms.
Scikit-learn development and maintenance is currently supported by major organizations like Microsoft, Nvidia, INRIA foundation, Chanel, etc.
The Scikit-learn library has become the de facto standard for ML (Machine Learning) implementations thanks to its comparatively easy-to-use API and supportive community. Here are some of the primary uses of Scikit-learn:
Here’s a small example of how Scikit-learn is used in Python for Logistic Regression:
from sklearn.linear_model import LogisticRegression; model = LogisticRegression().fit(X_train, y_train)
Explanation:
Now, you must have understood what is Scikit-learn in Python and what it is used for. Scikit-learn is a versatile Python library that is widely used for various machine learning tasks. Its simplicity and efficiency make it a valuable tool for beginners and professionals.
If you want to learn machine learning with the Scikit-learn library, you can join Ivy’s Data Science with Machine Learning and AI certification course.
This online course teaches everything from data analytics, data visualization, and machine learning to Gen AI in 45 weeks with 50+ real-life projects.
The course is made in partnership with E&ICT Academy IIT Guwahati, IBM, and NASSCOM to create effective and up-to-date learning programs.
Since 2008, Ivy has trained over 29,000+ students who are currently working in over 400 organizations, driving the technology revolution. If you want to be the next one, visit this page to learn more about Ivy’s Data Science with ML and AI Certification course.
Team Sep 10, 2022 No Comments
Machine learning is a complicated drill, but enacting machine learning structures is far less scary than it previously was because of the machine learning framework like Google’s TensorFlow. This framework eases the process of obtaining the data, training models, serving anticipations, and refining future outcomes. In this article, we will have a detailed look at what is TensorFlow and how it operates.
Formulated by the Google Brain team and primarily released to the audience in 2015, TensorFlow is an open-source library for numerical computation and large-scale ML. TensorFlow bundles together a range of deep learning and machine learning structures and also algorithms and makes them useful by way of relevant programmatic metaphors. It employs JavaScript or Python to offer an easy front-end API for constructing applications while implementing those apps in high-performance C++. Let us now start with tensor flow basics.
Let us begin this article on what is TensorFlow by knowing about his history. Many years ago, deep learning began to exceed all other ML algorithms when offering extensive data. Google has found it could utilize these deep neural networks to upgrade its services:
They constructed a framework known as TensorFlow to allow researchers and also developers to operate together in an AI structure. Once it is approved and is scaled, it enables a lot of people to employ it.
OIT was initially launched in 2015 while the first stable version came in 20170. It is an open-source platform under Apache Open Source Licence. The users can use it, modify it, and reorganise the revised variant for free without paying anything to Google.
To understand what is TensorFlow, you should first know about the various components of TensorFlow. So without any further delay, let us begin with this guide.
The name TensorFlow is obtained from its basic framework, “Tensor.” A tensor is basically a vector or matrix of n-dimensional that portrays all forms of data. Every value in a tensor holds a similar type of data with a relevant shape. The shape of the data is the dimension of the matrix or even an array.
A tensor can be developed from the outcome or the input data of a computation. In this data analytics framework, all tensor flow uses are conducted within a graph. The group is a set of calculations that occurs successively. Every transaction known as an op node is linked.
TensorFlow makes use of a graph structure. The chart assembles and also illustrates all the computations done at the time of the training.
You can consider the following expressions a= (b+c)*(c+2)
You can break the functions into components as given below:
d=b+c
e=c+2
a=d*e
A session can implement the operation from the graph. To stuff the graph with values of a tensor, we are required to open a session. Within a session, we must run an operator to form a result.
This data analytics framework is the better library for all as it is easily accessible to all. TensorFlow library accommodates varied API to formulate a scale deep learning frameworks such as Convolutional Neural Network (CNN) or Recurrent Neural Network (RNN).
This framework is based on graph computation as it can enable the developer to formulate the creation of the neural network along with Tensorboard. His tools enable debugging the program. It operates on GPU or CPU.
TensorFlow offers great operations and services when compared to other famous deep learning frameworks. TensorFlow is used to formulate a large-scale neural network with many layers.
It is primarily used for machine learning or deep learning issues such as Perception, Classification, Understanding, Discovering Predictions, and Creation.
Sound and voice recognition applications are the most popular use cases of deep learning. If the neural networks have proper input data feed, neural networks are capable of evaluating audio signals.
For Instance:
Image recognition is the first application that made machine learning and deep learning popular. Social Media, Telecom, and handset manufacturers, motion detection, image search, photo clustering, and machine vision.
For instance, image recognition is used to identify and recognize objects and people in the form of images. This is used to evaluate the context and content of any image.
In the case of object recognition, TensorFlow allows to classification and identify arbitrary objects within larger images. This is also availed in engineering applications to recognize shapes for the purpose of modeling and by Facebook for photo tagging.
For instance, deep learning utilizes TensorFlow for evaluating thousands of photos of cats. So a deep learning algorithm can learn to identify a cat as this algorithm is used in finding general features of objects, peoples, and animals.
Deep learning is using Time Series algorithms for examining the time series data for extracting meaningful statistics. For instance, it has employed the time series to anticipate the stock market.
A recommendation is the most common use scenario for Time Series. Amazon, Facebook, Google, and Netflix are employing deep learning for the suggestion. So, the algorithms of deep learning is used to evaluate customer activity and compare it to numerius of other users to evaluate what the user may wish to buy or watch.
For instance, it can be used to suggest us TV shows or even movies that people wish to see based pn movies and TV shows already watched.
The deep learning algorithm is jused for the purpose of video detection. It is used in the case of motion detection, real time threat detection in security, gaming, airports, and UI/UX areas.
For instance, NASA is formulating a deep learning network for objects clustering of orbit and asteroids classifications. So, it can anticipate and classify NEOs (Near Earth Objects).
Text based applications is also a famous deep learning algorithm. Sentimentals analysis, threat detection, social media, and fraud detection are the instanes of Text-based applications.
For instance, Google Translate supports more than 100 languages.
This article on what is TensorFlow would be incomplete if we do not talk about the features of this popular tool. TensorFlow has a synergistic multiplatform programming interface which is reliable and scalable in comparison to other deep learning libraries which is available. These features of TensorFlow will narrate us about the popularity of TensorFlow.
We can visualize every part of the graph which is not an option while utilizing SciKit or Numpy. To develop a deep learning application, primarily there are two or three components that are needed to formulate a deep learning application and require a programming language.
It is among the important TensorFlow features as per its operability. It offers modularity and parts of it which we wish to make standalone.
It can be trained conveniently on CPUs and in case of GPUs in distributed computing.
TensorFlow provides to the pipeline in the sense that we acn educated numerous neural networks and several GPUs which makes the frameworks very effective on large scale mechanisms.
Google has developed it, and there already is a big team of software engineers who operate on stability enhancement continuously.
The best thing about the machine learning library is that it is open so that any individual can it as much as they connection with the internet. So, individuals can manipulate the library andcome up with a great variety of useful items. And this has become another DIY space which has a huge forum for people who plan to start with and also those who find it difficult to work with.
TensorFlow has feature columns which could be identified of as intermediates between estimators and raw data, as per bridging input data with our framework.
We come to the colnclusing lines on what in TensorFlow? In recent times, this software has become the popular data learning library. Any deep learning framework like a RNN, CNN, or basic artificial neural network may be constructed using TensorFlow.
Startups, academics, and major corporations are the most common users of thai software. This is used in digitally all the products of Google that includes Gmail, Photos, and Google Search Engine.
Team Sep 01, 2022 No Comments
In the present scenario, data is the basis of virtually every association. Companies in the current market scenario produced a prominent quantity of the 79 zettabytes of big data anticipated by Statista and hence are responsible for the big share of its usage, storage, and processing. Data analytics frameworks are crucial to all large-scale data management and optimization efforts.
These frameworks combine effective processes with cutting-edge data technologies to formulate insight and effective strategies for the operations of the companies. Traditional models did not look at the requirements of the companies as a whole, hence playing with data and creating roadblocks to efficiency. Evaluating modern data analytics frameworks and imposing them successfully will be important for any business aiming to move ahead of the graph.
The data analytics framework in data analytics is a concrete mechanism for handling data analytics effectively and efficiently. But the term itself is used in various ways. At times, these illustrate data analytics frameworks. Will be talking about the whole process and also the best practices for handling data analytics. Major data analytics framework examples include, Sample, Model, and Assess (SEMMA), Explore, Modify, process, and the Cross-Industry Standard Process Data Mining (CRISP-DM) guidelines. In other scenarios, the phrase is used in connection with data analytics solutions such as Teradata Vantage, as well as burgeoning data trends like the data mesh design pattern.
In the case of practicals, think of data analytics frameworks as an amalgamation of technologies and processes. The prominent guidelines and also the solutions used will differ often broadly among companies. But the fundamental aim of data analytics frameworks is consistent and that is to help enterprises utilize analytics in a way that derives the the greatest possible value from the data. The scarcity of such a framework, and taking a piecemeal, disorganised strategy of data analysis is a choice in the present-day business world.
Companies typically base their data analytics frameworks on a clearly defined purpose. The aim of the basic data analytics framework can be initially something like “What business outcomes do we hope to achieve for our enterprise with data analytics?”. From there data teams are divided into different branches for more prominent operations.
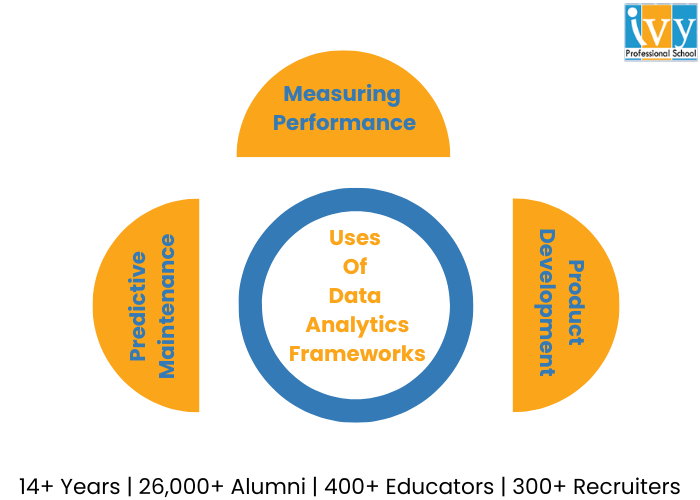
This is among the most commonly used scenarios for analytics and the frameworks supporting them. Companies are required to be consistently cognizant of everything that impacts their bottom line and gathering KPI (key performance indicators) and evaluating them is how they maintain awareness.
A data analytics framework offers data teams processes and also tools for broad-ranging performance assessment. For example profitability across varied business units along with its narrower operations such as keeping track of customer facing applications regulating users, engagement, and also new user adoption.
Presently, it is impossible to develop a new item in a vacuum. Development must be informed by data that include historical sales figures, KPIs related to the success or failure of the competitor with a similar product or service, demand analysis, projections of potential product failures, and many more.
The ability of various modern devices ranging from smartphones and medical wearables to modern cars to collect consumer behaviour data adds another dimension of insight developers can draw upon. Data analytics frameworks assure that product teams can take advantage of the last mistakes and determine better product design strategies for the future.
With this framework in place, manufacturers and other heavy industrial businesses can evaluate machine health, anticipate the likelihood of failure, and schedule priority repairs when required. This helps to minimize equipment downtime and keep production schedules on track. These frameworks of data analytics offer the structure analysts need to gather all the information crucial to making these anticipations such as a number of previous repairs, equipment age, indicators to wear and tear overall effectiveness, and many more.
To attain optimal results by using any data analysis framework, support cutting-edge technologies and also solutions:
1. Given that modern enterprise data management is predominantly driven by cloud trends, your framework should already be cloud-ready but without sacrificing your on-premise data infrastructure.
2. The hybrid multi-cloud deployment will offer you the most flexibility in this respect, specifically if the analytic requirements of your organisation include real-time stream processing.
3. Also, data integration from all relevant sources is very crucial and the solution and also the tools you utilize as a part of your structure should support this.
4. An analytics channel with warehousing potential, for instance, can offer an effective foundation for integration.
5. Utilizing object storage infrastructure to formulate a data lake that operates along with a data warehouse assures that all structured, unstructured, and semi-structured data can be categorized and formatted properly for later analysis and processing.
With that let us have a look at some of the best frameworks for data analytics for this year.
This is an end-to-end ML (Machine Learning) platform that features a comprehensive, flexible framework of elements and also libraries along with community resources, allowing one to construct applications that are powered by ML more conveniently. It also makes it more convenient to integrate data such as graphs, SQL tables, images all together. This was first formulated by Google Brain Team and to this day this remains completely open-source.
Scikit-learn is an open-source ML library that is used in the Python programming language, featuring several classifications, clustering, and regression algorithms. It is created for incorporating numericals and scientific libraries such as NumPy and SciPy, both of which are used and developed in Python.
Keras is a famous open source software library that has the potential to operate atop other libraries such as TensorFlow, CNTK, and Theano. With ample data, you can paddle in AI and Deep Learning over this framework.
A data manipulation and analysis language that is written in Python and for Python provides operations and data structures for manipulating NumPy based time series and dates. It is employed to normalise messy and incomplete data with features of slicing, shaping, merging, and dicing datasets.
A library with avid support for Java, Python, Scala, and R, this data analytics framework can be utilised on Hadoop, Kubernetes, Apache Mesos, over cloud services that deal with several data sources.
If you successfully deploy a data analytics framework based on sound principles of data science and are supported by reliable, agile technologies, your company has the ability to identify various advantages. Here are some of the most notable advantages of data analytics frameworks.
A cloud-centric analytics framework enables the coexistence of multiple types of data and permits several methods of analytics. Together, it helps prominently speed up the integration and efficient use of data, cutting down on time to evaluate and minimizing performance bottlenecks.
Hence, less time is spent on preparing, processing, and also reconfiguring data implying more time can be devoted to using data in innovative ways. The speed of integration and use also enables real-time data processing. This can enhance customer service, boost more efficient internal collaboration and innovation, and facilitate operational efficiency.
Using a cutting-edge, cloud-based data analytics framework offers your company the potential to store, access, and utilize all your data without reformatting, duplicating, or moving it around. Instead of having data spread out and in various incompatible formats, you can enter straight into analytics, innovations, and applications. This finally, will support an end-to-end view of the business and formulate an SSOT (Single Source Of Truth).
In an unpredictable business scenario when the customer demands and the requirements of the organization can alter immediately, a data analytics framework that enables you to boost on a dime is invaluable. That is exactly what you get with a cloud framework. This scalability can also boost cost savings. The tools that are utilized in more traditional analytics frameworks can be quite expensive and include rigid pricing structures, but cloud analytics solutions enable you to pay only for what you see.
There are various strategies for business analytics and numerous tools that support them, and the industry will evolve wider in the near future. Instances of key trends to watch include:
1. The sector for self-servicing reporting prevails to expand as more business users grow their inclination towards taking advantage of analytics without requiring the expertise of a data scientist, engineer, or analyst.
2. Deep learning, which is the advanced form of ML (Machine Learning) based on a multi-layer neural network, will slowly increase as more companies attain the resources required to support their computations.
3. Researchers anticipate the adoption of data fabric ideas to increase because of rising interest in real-time streaming analytics.
Data teams should keep a track of these and other developments and evaluate whether they should adopt their data analytics frameworks and architectures to accommodate them.
Data analytics frameworks are crucial to all large-scale data management and optimization efforts. These frameworks combine effective processes with cutting-edge data technologies to formulate insight and effective strategies for the operations of the companies.
The 5 types of data analytics include Descriptive Analytics, Diagnostic Analytics, Predictive Analytics, Prescriptive Analytics, and Cognitive Analytics.
The top 3 best data analytics framework types include TensorFlow, Scikit-learn, and Keras.
Team Jul 27, 2022 No Comments
The lives of individuals, businesses, and industries have been devastated by Covid-19. The world came to a halt in 2020 and has started to resurrect itself in a completely new dimension. The Covid-19 pandemic shows the vital necessity for fast and reliable data sources that are both individualized and population-wide to generate data-driven insights into disease surveillance and control, because of its tremendous consequences on global health and economics. This is where data science comes in. The impact of data science post covid is huge.
Every company benefits from data science post covid With the increasing complexities and shifting needs of customers, data is becoming increasingly important. Data Science combines programming, mathematics, and statistics ability to develop data-driven insights using statistical figures, patterns, and trends. Because they are unable to function according to their initial business goals, the present Covid-19 situation has added to the complications for businesses.
Covid-19 has broken the historical analytics paradigm so significantly, according to McKinsey, that pre-Covid data must be viewed in a separate historical context. The quick breakout of the pandemic compelled organizations to make a sudden jump to accommodate the changing requirements of the moment. However, other businesses and sectors adapted successfully to the circumstance by developing new data science procedures that could be implemented much more quickly. As entire operations had to be moved to a completely remote and wireless platform, the following trends were expected to be observed in Data Science trends.
• More technology-driven research.
• More connected infrastructure.
• Brands attempting to keep up with the fast-paced digital maturity required to stay relevant and competitive.
Data science volume utilizes large volumes of data to make an informed decision regarding business. It is basically a study to formulate new products. Typically, data analysts analyze data and find new insights. They support companies in making progress with gathered data. Modern data analysts can be called part mathematicians, part computer scientists, and also part trend spotters. They operate in advanced ML (Machine Learning) frameworks and are aware of the technicalities to anticipate future customers or market behavior dependent on previous trends.
The goal of businesses from data analysts is to make decisions that are data-driven for a powerful business impact. Demand for data scientists is relatively high with great opportunities to evolve. However, with the latest coronavirus pandemic, there was a bit of flattening out of the demand. Currently, after two years of the pandemic, there are no indications of a decrease in the demand for data scientists and a slowing down of data science.
With evolving data, the requirement for data analysis and making sense of the assembled data is also rising. Hence, there is no such thing as data science post covid. There is a sky-high pay and evolving demand for data scientists in several companies. It has resulted in a serious upward career arc.
The role of Data Science has become all the more important after the Covid-19 crisis. For example, industries that have incurred losses will adopt more aggressive business approaches to improve sales and better understand the needs of the customers. Economic and everyday life disturbances can force any company to make considerable changes in order to stay competitive. And that is what has happened with the pandemic. Companies started using Data Science to their advantage in the following ways.
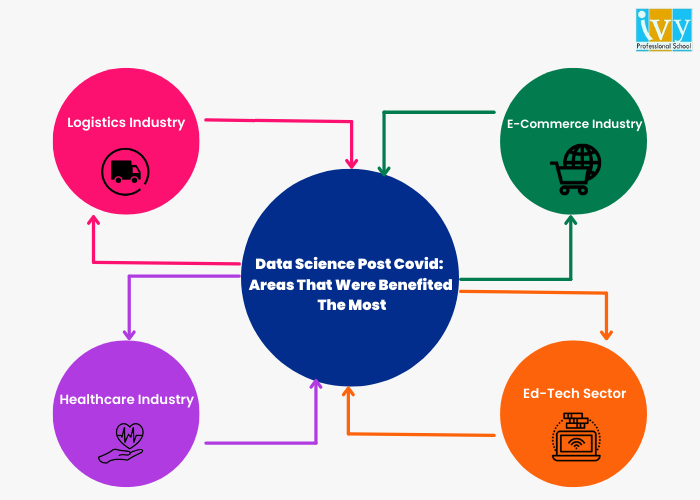
The key areas where data science has gained paramount importance post-Covid 19 are as follows.
The logistics industry went through a massive change post-Covid and Data Science has a significant role to play in it.
The AI model data helps companies understand different kinds of scenarios and limitations such as geographical restrictions that may be in effect due to rising Covid-19 cases.
Predictive analytics is a significant application of Data Science in healthcare. The predictive model examines and learns from historical data, identifying trends and making predictions based on them.
Individuals use the digital space in healthcare to explore better services and delivery because the risk of visiting a hospital during Covid-19 is very high. In healthcare, data science assists hospitals in identifying many symptom connections among a group of users on health portals. By creating records, hospitals can improve special care. They can also improve supply chain efficiency to improve patient outreach.
People used to go to malls to shop and eat at restaurants a few years ago. Customers began to shop from online platforms at their leisure after the Covid 19 outbreak, avoiding the risk of contracting the virus.
People are now able to purchase products of their choice from the comfort of their own homes, and artificial intelligence is presenting them with an experience akin to that of a physical visit. Customers of online shopping platforms receive a customized experience based on their data profiles.
The industry shifted most of the world into emergency remote learning settings after Covid-19 hit the world and led to the temporary closure of schools and educational institutes. Educational Institutions around the world shifted to video conferencing capabilities, online learning management software, and other digital alternatives.
The use of software and data science in the education industry to predict the use and effectiveness of delivery systems is still improving. Data science aids in determining the total impact of existing tools and software, as well as maximizing the use of technology to enhance the learning experience.
The effect of AI (Artificial Intelligence) on the economy and on our lives has been quite astonishing. There are countless instances and applications of AI. Expectations from AI are human-like and the artificial intelligence technologies are categorized into sense, comprehend, and act. The machine must perceive and sense the data via audio-visual processing. It must identify the pattern and evaluate the data as a pattern or context. AI must allow the machine to obtain potential insights that can support actions.
One of the prominent challenges in adopting AI is privacy. AI operates on a huge volume of confidential data. The data is seldom sensitive and personal. Unclear security, privacy, and ethical regulations formulate a plethora of challenges. In some nations, the General Data Protection Regulations (GDPR) act adds further obstacles to the adoption of AI. Along with that, AI requires highly trained and skilled professionals. Scarcity of awareness of the adoption of AI in businesses, technology, infrastructure, and research poses further issues. However, entities and businesses are aggressively adopting AI and aiming at diversifying it.
As a result, the post-COVID-19 age presents a chance for the next generation of data scientists. Data science post covid witnessed immense popularity and significance. However, data scientists must drastically improve their skills to advance to the next level. There are various opportunities to upskill and make a career in the field of Data Science. When it comes to Data Science, one institute that deserves a special mention is Ivy Pro School.
Since 2008, Ivy Professional School has continuously ranked among the top data science and analytics training institutions. Ivy has well-accomplished faculty with more than ten years of industry experience. It aims to provide specific learning experiences that organizations are looking for in their prospective data science candidates.
Team Jul 22, 2022 No Comments
How do you think you get product recommendations on an E-commerce site or how do you think taxi booking services monitor traffic conditions and adjust prices accordingly? The answer is “Data Science”. With technological advancements and growing changes in the world of business, Data has become of paramount importance to industries, corporate houses, and government sectors. This is where the science behind data comes in. Here is an easy data science guide for you.
In simple words, Data Science is the field of study that deals with huge volumes of data using new-age techniques and tools. It finds patterns and derives meaningful insights from the vast amount of unstructured data and helps businesses make informed decisions. The data that is analyzed comes from various sources and is presented in different kinds of formats. Data Science comprises various tools, machine learning principles, and algorithms that assist in discovering hidden patterns from the available raw data.
Earlier, the data that we had was mostly structured and very small in size and therefore it was easier and simpler to analyze it. In recent times, the data generated from various sources is mostly unstructured or semi-structured. This cannot be analyzed or processed with simple BI tools. To analyze and draw insights from these data obtained from text files, multimedia forms, financial logs, and instruments, more complex and advanced analytical tools are required. This is the reason why Data Science is gaining so much popularity these days.
The usability of data science is huge. It is used in almost all sectors and is given utmost importance. Especially, in post covid era, the use of data science has increased. This infographic will give you a gifted idea of the areas where data science is sued.
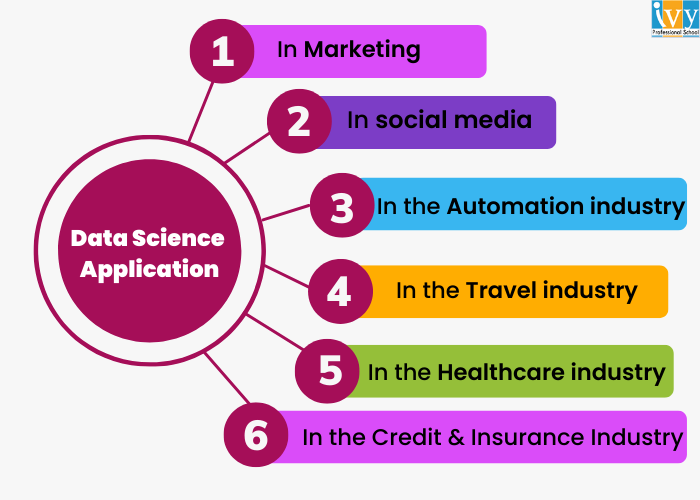
Let us now examine how Data Science is being used beneficially across multiple fields and sectors.
• In Marketing, Data Science is used for getting valuable customer insights, real-time interactions, customer segmentation, targeting, cross-selling, and predicting the lifetime value of a customer.
• In Sales, Data Science is used for future sales prediction, discount offers, etc.
• In social media, Data Science is used for measuring marketing performance KPIs, monitoring the effectiveness of campaigns, creating personalized ads, sentiment analysis, and much more.
• In the Automation industry, Data Science is used for self-driven cars.
• In the Travel industry, Data Science is applied to predicting flight delays and dynamic pricing.
• In the Healthcare industry, Data Science is applied for medication effectiveness and the prediction of diseases.
• In the Credit & Insurance Industry, Data Science detects fraud and risks and is also used for claims prediction.
In this data science guide, it is crucial that we look into the job profile of a data scientist. Data Scientists are those who crack complicated data issues along with the strong expertise in several scientific disciplines. They operate with various elements associated with mathematics, computer science, statistics, and many more. They make a lot of utilization of the latest technologies in finding solutions and attaining conclusions that are important for the development and growth of an organization. Data scientists offer the data in a much more effective and useful format in comparison to the raw data that is available to them in structured along with the unstructured forms. All data scientists should hold a data science degree.
The Data Science profession is challenging but fortunately, many tools make the job of Data Scientists easier. Some of the tools include MATLAB, Excel, SAS, Jupyter, Tableau, Cognos, R Studio, RAW, Azure ML studio, and much more. Owing to the increasing demand for the subject in the industry, there is a rising need for more and more professionals to have in-depth knowledge about Data Science. Data Science jobs are not only high paying but are also in demand. There are many definitions available for Data Scientists. A very common definition of Data Scientists is that they are people who know the art of Data Science. They crack complex problems with their knowledge and work with several elements like mathematics, computer science, statistics, etc. Data Scientists offer data in a useful way. Data Scientist experts are needed in every sector and tech company. They are highly educated and are in demand these days. The various Data Science job options are Data Scientist, Machine Learning Engineer, Machine Learning Scientist, Application Architect, Enterprise Architect, Data Engineer, Data Engineer, and much more.
The process of analyzing and acting upon data isn’t linear and the Data Science lifecycle flows in the following ways.
• Defining a project and its potential outputs.
• Exploring, pre-processing, and conditioning the data before modeling. Data Scientists need the right tools and access to the right data.
• In this phase, model planning is done where one needs to determine the techniques and methods to draw a relationship between two variables. Various common tools are used for model planning.
• In this phase, Data Scientists develop datasets for training and testing purposes. Various learning techniques are analyzed to build the model.
• In this phase, final reports, briefings, and technical documents are delivered. A pilot project is executed at this stage.
• In this phase, the results are communicated to the stakeholders.
There are many Data Science guide courses available that will help you build a successful career in the field of Data Science. However, it is very important to pursue the course from the right place. Ivy Professional School is the pioneer in Data Science and has committed to providing in-depth subject knowledge to the students to make them professionally competent. Ivy Pro School’s collaboration with NASSCOM will unlock great opportunities for Data Science candidates and help them build the career of their dreams. The Data Science course at Ivy Pro School includes high-demand tools like Python, R, Tableau, SQL, Adv Excel, VBA, etc. So if you are interested in building your skills in the field of Data Science, the best way to learn data science is with us. Hope this guide about data science for beginners helped you.
1. Can I self-learn data science?
One can learn data science on their own with online data science courses or also even from YouTube videos. There is no paucity of learning materials on the internet if one is working towards a career in this field. Having said that, self-learning lacks structure, and one might not know what crucial elements one is missing.
2. What is data science A Beginner’s Guide to data science?
In simple words, Data Science is the field of study that deals with huge volumes of data using new-age techniques and tools. It finds patterns and derives meaningful insights from the vast amount of unstructured data and helps businesses make informed decisions.
3. What are the basics needed for data science?
In Marketing, Data Science is used for getting valuable customer insights, real-time interactions, customer segmentation, targeting, cross-selling, and predicting the lifetime value of a customer.
Team Jul 20, 2022 No Comments
Data analytics is all about collecting and analyzing raw data to find valuable patterns and insights that answer questions or solve problems. This helps businesses make smart decisions, improve efficiency, increase customer satisfaction, and drive more revenue.
If you want to master data analytics, you must know the different types of data analytics employed in industries. So, in this post, we will discuss the four main data analytics types in detail with examples. You will understand what they are, how they differ from each other, and why they are important.
There are four main types of data analytics: descriptive, diagnostic, predictive, and prescriptive analytics. Each of them answers a certain question that helps businesses better understand the past, present, and future and take smart actions to achieve their goals. Let’s understand them in detail:
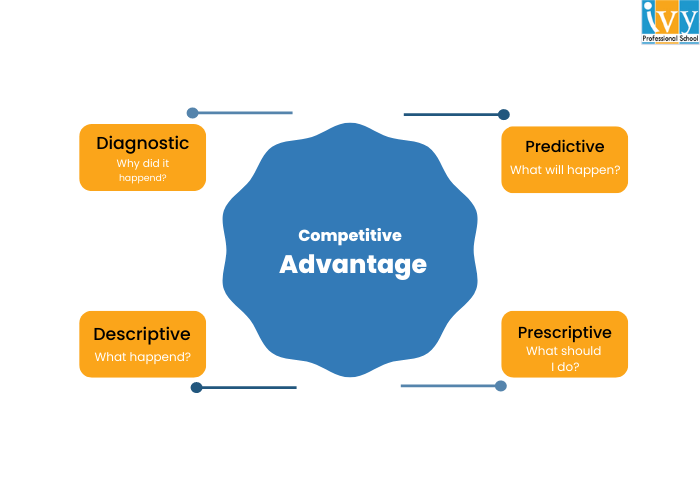
Descriptive analytics is the most basic type of data analytics currently used. It analyzes historical data to find out what has happened in the past or what is happening in the present.
It uses various techniques such as data aggregation, data mining, and reporting to spot patterns and trends over time. It may use arithmetic means to show an average of the values or frequency distribution to show how often a value occurs in the dataset.
Descriptive analytics uses visualization techniques like creating charts and graphs to visually represent complex data, making it easy to identify trends.
Examples of Descriptive Analytics
Let’s say you run an online store, and you want to know how much you sold in the last six months. So, you will use descriptive analytics to analyze monthly sales data and find peak sales periods and underperforming months. You can also identify top-selling products.
Similarly, businesses can use descriptive analytics to analyze:
Diagnostic analytics helps us go further than descriptive analytics. Now that we already know what has happened, diagnostic analytics helps us answer the valuable question, “Why did it happen?” That means we understand the cause of the trends and patterns we just found in the descriptive analytics.
You may use different methods like drill-down analysis, correlation analysis, Pareto analysis, fishbone diagram, hypothesis testing, etc., to effectively understand the cause of an event. This way, businesses can identify areas of improvement and make better strategies.
Examples of Diagnostic Analytics
Let’s say in the above sales report, you found that a particular month had significantly low sales. So, you use diagnostic analysis and find the cause: you had low product stock and couldn’t meet the customer demand effectively.
Similarly, businesses may use diagnostic analytics to find out:
When you know the problem and why it’s happening, you will be able to find effective solutions to make things better. Now, let’s move to our third type of data analytics:
Related: Data Scientist vs. Data Analyst
Now, we are getting into advanced analysis. Predictive analytics uses historical data, statistical models, and machine learning algorithms to figure out what may happen in the future. It can predict future events, trends, outcomes, and behaviors that may affect the business performance.
Techniques used in this type of data analytics can be time series analysis to identify patterns, regression analysis to identify relationships between variables, or decision trees to represent the decision-making process and predict outcomes. The idea is that once you know what will happen, you can better prepare for the challenges and get ready to take advantage of opportunities.
Examples of Predictive Analytics
Coming back to our online store example, let’s say you found that you had low sales because of an inventory shortage. Now you want to fix this problem. So, you may use predictive analytics to forecast the demand for various products. This way, you can have optimal inventory levels to meet the demand, avoiding inventory shortage as well as overstocking.
Predictive analytics can also be used to:
This is the most advanced type of data analysis that combines descriptive, diagnostic, and predictive analytics. It helps us find out what actions we should take to avoid an undesirable outcome or achieve a desirable outcome.
So, the goal of prescriptive analysis is to provide actionable recommendations. It may use techniques like optimization modeling to find the best solution with given constraints, simulation to evaluate different scenarios, or artificial intelligence techniques to automate decision-making processes.
Examples of Prescriptive Analytics
You used predictive analytics to find the demand forecasts. Now, prescriptive analytics goes further by recommending specific actions to achieve the maximum sales. It suggests how to optimize inventory based on predicted demand, supply chain factors, and business goals. You will also know how much inventory to order and when to order it.
You can also use prescriptive analytics to find actionable insights for these questions:
Now you know the four types of data analytics and how they depend on each other. The goal of data analytics is to help businesses identify areas for improvement, increase efficiency, and enhance processes. That’s why data analysts are in demand in the current industry.
If you want to be a data analyst, you can join Ivy Professional School’s Data Analytics Certification course. This is a live online program taught by industry professionals from IIT, IIM, and US universities. You will learn to use tools like Excel, SQL, Python, R, and Tableau with 50+ assignments, 30+ case studies, & 10+ industry projects. Visit this course page to learn more about it.

Eeshani Agrawal holds an MS in Civil Engineering from Texas A&M University (USA) and has over 16 years of experience in data visualization, storytelling, and analytics. She has consulted for top engineering, manufacturing, and consulting firms worldwide and has coached over 9,000 professionals and students from leading institutions like IITs, IIMs, and ISI.
Team Jun 12, 2022 No Comments
The CEO of LinkedIn Jeff Weiner had once said that “Data really powers everything that we do.” Data is indeed everywhere, starting from healthcare to search engines. With so many complexities and unpredictabilities in the world of business, there has been an increasing need for analyzing, cleaning and manipulating data. This is where Data Science comes in. Data Science is defined as the field
Team Nov 06, 2021 No Comments
Today, we are going to learn about one of the most interesting and exclusive concepts that apply everywhere in business applications: Case Studies. A case study is an important and useful way to learn about the practical applications of business using science models. These science models are usually those which help us apply logic to business scenarios. Our very t