Team Mar 25, 2023 No Comments
Staying up-to-date with the latest happenings in data science is crucial due to the field’s rapid growth and constant innovation. Beyond conventional ways to stay updated and get information, podcasts can be a fun and convenient way to access expert insights and fresh perspectives. They can also provide crucial information to help you break into a data science career or advance it successfully.
Here is a list of some popular podcasts any data enthusiast cannot afford to miss this year.
Michael Helbling, Tim Wilson, and Moe Kiss are co-hosts who discuss various data-related topics. Lighthearted in nature, the podcast covers a wide range of topics, such as statistical analysis, data visualization, and data management.
Professor Margot Gerritsen from Stanford University and Cindy Orozco from Cerebras Systems are the hosts, and it features interviews with leading women in data science. The podcast explores the work, advice, and lessons learned by them to understand how data science is being applied in various fields.
Launched in 2014 by Kyle Polich, a data scientist, this podcast explores various topics within the field of data science. The podcast covers machine learning, statistics, and artificial intelligence, offering insights and discussions.
Not So Standard Deviations is a podcast hosted by Hillary Parker and Roger Peng. The podcast primarily talks about the latest advancements in data science and analytics. Staying informed about recent developments is essential to survive in this industry, and the podcast aims to provide insights that will help listeners to do that easily. By remaining up-to-date with the latest trends and innovations, listeners can be in a better position to be successful in this field.
Hosted by Xiao-Li Meng and Liberty Vittert, the podcast discusses news, policy, and business “through the lens of data science,” Each episode is a case study of how data is used to lead, mislead, and manipulate, adds the podcast.
Data Stories hosted by Enrico Bertini and Moritz Stefaner is a popular podcast exploring data visualization, data analysis, and data science. The podcast features a range of guests who are experts in their respective fields and discuss a wide variety of data-related topics, including the latest trends in data visualization and data storytelling techniques.
Felipe Flores, a data science professional with around 20 years of experience hosts this podcast. It features interviews with some of the top data practitioners globally.
Dr.Francesco Gadaleta hosts this podcast. It provides the latest and most relevant findings in machine learning and artificial intelligence, interviewing researchers and influential scientists in the field. Dr. Gadaleta hosts the show on solo episodes and interviews some of the most influential figures in the field.
Making Data Simple is a podcast that is hosted by AL Martin, the IBM VP of Data and AI development. The podcast talks about the latest developments in AI, Big data, and data science and their impact on companies worldwide.
Hosted by Emily Robinson and Jacqueline Nolis, the podcast provides all the knowledge needed to succeed as a data scientist. As per the website, the Build a Career in Data Science podcast teaches professionals diverse topics, from how to find their first job in data science to the lifecycle of a data science project and how to become a manager, among others.
Discretion: The list is in no particular order.
Team Mar 21, 2023 No Comments
A mere century ago, no one could have imagined we would be so reliant on technology. But, here we are, constantly being introduced to some of the smartest, trendiest, and mind-boggling automation procedures. The modern world will come to a screeching halt without the intervention of up-to-the-minute software, framework, and tools. TinyML is the new addition to the category of up-to-date technologies and telecommunications.
There are very few authentic resources available that put light on TinyML. TinyML: Machine Learning with TensorFlow Lite on Arduino and Ultra-Low-Power Microcontrollers, authored by Daniel Situnayake and Pete Warden, is a prestigious and reliable source that answers the question: ‘what is TinyML?’. TinyML is an advancing field that combines Machine Learning and Embedded Systems to carry out quick instructions on limited memory and low-power microcomputers.
Another important feature of TinyML – the only machine learning framework it supports is TensorFlow Lite. Not sure what TensorFlow is? Check the detailed guide on TensorFlow .
Waiting long for machine learning magic is not a pleasant experience in every situation. When regular Machine Learning comes across commands like ‘Okay Google’, ‘Hey Siri’, or ‘Alexa’, the response can be time-intensive. But, the goal is quick responses from small directions like these. The desired fast reaction is only possible when the TinyML application is in effect.
It’s time to dive deep into the discussion of TinyML:
What is TinyML?
TinyML is a specialized study of Machine Learning that sits in the middle of embedded systems and machine learning (ML). It enables expansion and disposition of complex ML models on low-power processors that have limited computational abilities and memory.
TinyML allows electronic accessories to overcome their shortcomings by gathering information about the surroundings and functioning as per the data collected by ML algorithms. It also enables users to enjoy the benefits of AI in embedded tools. The simplest answer to ‘what is TinyML?’: TinyML is a framework to safely transfer knowledge and intelligence in electronic devices using minimal power.
The rapid growth in the software and hardware ecosystems enables TinyML application in low-powered systems (sensors). It warrants a real-time response, which is highly in demand in recent times.
The reason behind the growing popularity of TinyML in the real world is its ability to function perfectly fine without necessitating a strong internet connection, and massive monetary and time investment. It is rightly labeled as a breakthrough in the ML and AI industry.
TinyML has successfully addressed the shortcomings of standard Machine Learning (ML) models. The usual ML system cannot perform its best without entailing massive processing power. The newest version of ML is ready with its superpower to take over the industry of edge devices. It does not disappoint by demanding manual intervention such as connecting the tool to a charging point just to process simple commands or perform small tasks.
The application enables the prompt performance of minute but integral functions while eliminating massive power usage. A father figure in the TinyML industry, Pete Warden says, TinyML applications should not necessitate more than 1 mW to function.
If you are not well-versed in the basic concept of machine learning, our blog might help you understand it better.
New-age data processing tools and practices (Data Analytics, Data Engineering, Data Visualization, Data Modeling) have become mainstream due to their ability to offer instant solutions and feedback.
TinyML is solely based on data computing ability; it’s just faster than others. Here are a few uses of TinyML that we all are familiar with but probably, were not aware of the technology behind these:
Usually, a user anticipates an instant answer or reaction from a system/device when a command is stated. But a thorough process involving the transmission of instructions to the server and device capacitates the outcome. As one can easily fathom that this long process is time-consuming and thus the response gets delayed sometimes.
TinyML application makes the entire function simple and fast. Users are only concerned with the response; what goes inside does not pique the interest of many. Modern electronic gadgets that come with an integrated data processor are a boon of TinyML. It encourages the fast reaction that customers are fond of.
The exhaustive system of data management, transmission, and concocting can be intense. It also accelerates the risk of data theft or leak. TinyML safeguards user information to a great extent. How? The framework allows data processing in the device. The growing popularity of Data Engineering has also skyrocketed the need for safe data processing. From an entirely cloud-based data processing system to localized data processing, data leak is not a common problem for users anymore. TinyML erases the need to secure the complete network. You can now get away with just a secured IoT device.
A comprehensive server infrastructure is an ultimate foundation to ensure safe data transfer. As TinyML reduces the need for data transmission, the tools also consume less energy compared to the models manufactured before the popularity of the field. The common instances where TinyML is in use are microcontrollers. The low-power hardware uses minimal electricity to perform its duties. Users can go away for hours or days without changing batteries, even when they are in use for an extended period.
Regular operations using ML demand a strong internet connection. But, not anymore when TinyML is in action. The sensitive sensors seize information even without an internet connection. Thus, no need to worry about data delivery to the server without your knowledge.
Though it’s almost perfect, but not free from flaws. When the world is fascinated by the potential of TinyML and constantly seeking answers to ‘what is TinyML?’; it’s important to keep everyone informed of the challenges the framework throws at users. Combing through the internet and expert views, a few limitations of TinyML have been listed here:
Regular ML models use a certain amount of power that industry experts can predict. But TinyML does not leverage this advantage as each model/device uses different amounts of electricity. Thus, forecasting an accurate number is not possible. Another challenge users often face is an inability to determine how fast they can expect the outcome of commands on their device.
The small size of the framework also limits the memory storage space. Standard ML models weed out such complications.
The current retail chains manually monitor the stocks. The precision and accuracy of state-of-the-art technologies (such as TinyML) deliver better results compared to human expertise. Tracking inventories becomes straightforward when tinyML is in action. The introduction of footfall analytics and TinyML has transformed the retail business.
TinyML can be a game-changer for the farming industry. Whether it’s a survey of the health of farm animals or sustainable crop production, the possibilities are endless when the latest technologies are combined and adopted.
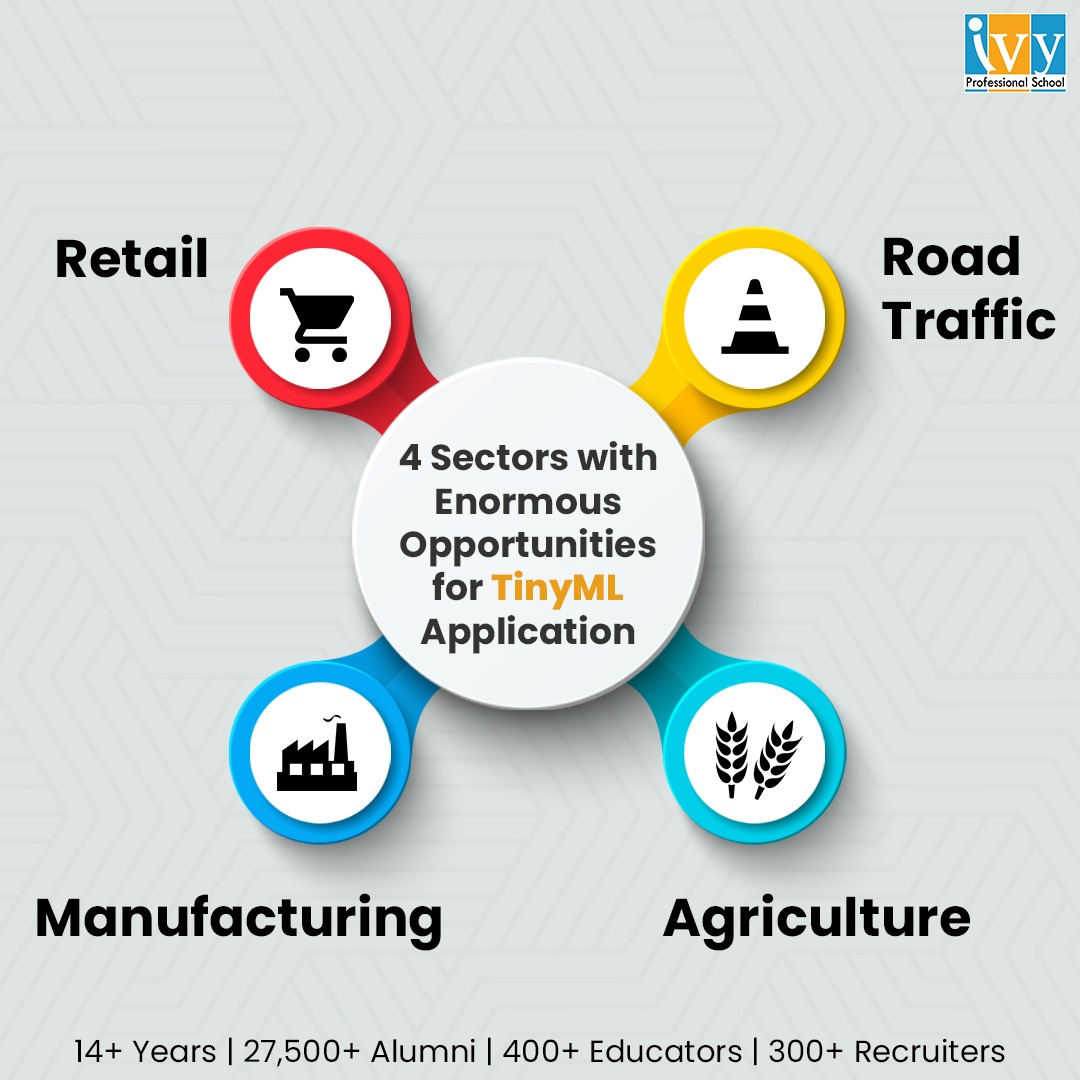
The smart framework expedites factory production by notifying workers about necessary preventative maintenance. It streamlines manufacturing projects by implementing real-time decisions. It makes this possible by thoroughly studying the condition of the equipment. Quick and effective business decisions become effortless for this sector.
TinyML application simplifies real-time information collection, routing, and rerouting of traffic. It also enables fast movement of emergency vehicles. Ensure pedestrian safety and reduce vehicular emissions by combining TinyML with standard traffic control systems.
Experts believe we have a long way to go before we can claim TinyML as a revolutionary innovation. However, the application has already proved its ability and efficiency in the machine learning and data science industry. With an answer to the question ‘what is TinyML?’, we can expect the field to advance and the community to grow. The day is not far away when we will witness the application’s diverse implementation that none has envisaged. TinyML is ready to go mainstream with the expansion of supportive programming tools.
If you are someone with immense interest in the AI, ML, and DL industry, our courses might uncover new horizons and job opportunities for you. Check the website of Ivy Professional School to enroll in our training programs!
Team Mar 15, 2023 No Comments
Finally, GPT-4 is here – It can now take images, videos, and text inputs and generate responses.
The wait for the much anticipated GPT-4 is over.
Microsoft-backed OpenAI has revealed the launch of its highly anticipated GPT-4 model. It is being hailed as the company’s most advanced system yet, promising safer and more useful responses to its users. Fo
Team Jan 11, 2023 No Comments
The world has been captivated by ChatGPT, a sizable language model. Its possibilities appear limitless to many. The AI develops games, codes write poetry, and even offers relationship advice. An alternative to ChatGPT appeared: YouChat AI Bot. In this article, we will learn more about this bot.
Following ChatGPT, users and academics alike have started to speculate about what highly developed, generative AI would entail for search in the future. According to Rob Toews from Forbes,
“Why enter a query and get back a long list of links (the current Google experience) if you could instead have a dynamic conversation with an AI agent in order to find what you are looking for?”
Toews and other experts claim that the obstacle is the huge language models’ susceptibility to inaccurate data. Many are concerned that the confident erroneous responses provided by tools like ChatGPT could amp up propaganda and misinformation.
That changes today.
Citations and real-time data have been added to You.com’s extensive language model, enhancing its relevance and precision. It enables you to find answers to complicated questions and also unlocks operations that were never seen before in a search engine.
You may chat with YouChat AI Bot, an AI search assistant that is similar to ChatGPT, directly from the search results page. You can trust that its responses are accurate because it keeps up with the news and cites its sources. Additionally, YouChat becomes better the more you use it.
For using it, you will have to simply make a query at You.com
With the help of the YouChat AI Bot, you may communicate with your search engine in a way that is human-like and quickly find the answers you need. When you ask it to perform different duties, it answers. It may, for instance, give sources, summarise books, develop code, simplify complicated ideas, and produce material in any language. Some of our favorite use cases are listed below:
The first significant language model that can respond to inquiries about recent occurrences is YouChat AI Bot.
This AI bot helps you to get answers to all types of questions that our traditional search engines cannot answer.
YouChat is better than ChatGPT at logic games. Take a look at this:
Step-by-step solutions and explanations are included immediately in the search results to assist students in learning.
Curious about someone or something? Ask YouChat anything.
YouChat also shows old images and links that are both pertinent and out-of-date for a variety of themes, much like other AI models. Additionally, YouChat is significantly more upfront in that regard and provides extensive instruction for inquiries with obviously hostile purposes, whereas ChatGPT has been trained to refuse to answer any potentially destructive questions. It’s okay to be forgiving, though, as this is just YouChat’s initial release.
Before we draw any conclusions on whether YouChat can replace ChatGPT or not, here is a brief description of what is ChatGPT and its limitations as well.
ChatGPT is an AI-powered automated program that uses machine learning and deep learning to respond to user questions. It answers all fact-based questions from users in a professional manner. It also excels at generating original and imaginative responses.
In order to create answers that are optimized based on previous user responses, ChatGPT can remember what users have previously said in the chat.
The chatbot helps the users by suggesting them follow-up edits and supporting them in having a comprehensive comprehension of the topic they are chatting about, which is another fantastic feature.
As some users might manipulate the chatbots into making inappropriate requests, which could lead to major crimes, ChatGPT is good at spotting hazardous things.
Everything has its pros and cons. Now that you know what ChatGPT is, let us also look at its limitations.
Given that YouChat is extremely new and will inevitably have restrictions in the future, ChatGPT has more constraints than YouChat. Although each of them has advantages of its own, analysts predict that YouChat will surpass ChatGPT given its restrictions.
YouChat AI Bot is the first major language model enhanced for improved relevance and accuracy. We will keep working hard to reduce and limit the spread of false information, even though biases and AI traps are still a problem.
If you want to know more about how ChatGPT or similar AI bots operate, here is a Sentiment Analysis of ChatGPT using Webscraping in Python from Ivy Professional School’s special bootcamp session.
Ivy Professional School is one of the leading Data Science institutes in India. It offers great courses in data science, data engineering, and Machine Learning that you can enroll in. They offer expert-led courses along with complete placement assistance. Join Ivy and get to work on real-life Machine Learning projects to make your resume more reachable to recruiters. For more details visit their website.
Team Jan 08, 2023 No Comments
The Data Science industry is anticipated to grow by 26% according to a report by Forbes, but Data Science as a niche is still unknown to many. The Data Science team everywhere helps in managing, organizing, and tackling the regular data. This is a multidisciplinary field that needs skills in math, statistics, computer science, and many more. In the last few years, the Data Science filed has witnessed immense growth in all sectors including education. In this article, we will have a look at the various applications of Data Science in education industry.
Numerous potentials for data scientists to find cutting-edge uses of Data Science in education have arisen as a result of the abundance of educational data. Additionally, by comprehending the various student types, the analysis of big data may aid the education sector in finding solutions to their challenges.
There is a tonne of student data that schools, colleges, and universities must manage, including academic records, outcomes, grades, personal interests, cultural interests, etc. They can discover cutting-edge strategies to improve student learning with the aid of the examination of this data.
The education industry can benefit greatly from modern Data Science technologies. For this, a variety of machine learning techniques are utilized, including Random Forest, Logistic Regression, Decision Trees, Support Vector Machines, etc. Data Science applications in education, however, are still few and far between.
However, there are still a lot of untapped use cases for Data Science that might help the education sector succeed. A few applications of Data Science in education are listed below.
Now that we are aware of the benefits Data Science is bringing to the sector of education. Let’s look at many ways that Data Science in education might be applied. These can also be termed as the various advantages of Data Science in education.
There are many distinct types of students being taught simultaneously by one teacher in a classroom. It happens frequently that some students excel in class while others struggle to grasp the material.
Data from assessments can be used by teachers to assess students’ comprehension and change their pedagogical approaches moving forward.
Before, evaluation methods were not real-time, but as Big Data Analytics developed, it became possible for teachers to have a real-time understanding of their students’ needs by observing their performance.
With the use of multiple-choice questions and systems like ZipGrade, evaluations can be completed more quickly. Although helpful, this method can be a little tiresome and time-consuming.
Any student must have strong social skills because they are crucial to both their academic and professional lives. A student cannot connect or communicate with his or her peers without social or emotional abilities, and as a result, fails to form relationships with his environment.
The advancement of social-emotional abilities requires the help of educational institutions. This is an illustration of a non-academic talent that significantly affects students’ learning abilities.
Although there have previously been statistical surveys that could evaluate these abilities, modern Data Science tools can aid in a more accurate assessment. Using formalized knowledge discovery models in Data Science and Data Mining techniques, it is possible to capture such enormous amounts of data and integrate them with modern technologies to get superior outcomes.
Additionally, data scientists can utilize the gathered data to run a variety of predictive analytical algorithms to help teachers understand why their students are motivated to take the course in question.
Parents and other guardians are crucial to children’s education. Due to parents’ carelessness, many disturbed adolescents achieve below average in school. Therefore, it becomes crucial for teachers to have regular parent-teacher conferences with the guardians of all pupils.
Data Science can be utilized to guarantee the greatest possible participation at those gatherings. In order to analyze the history or similarities between all the families with such behavior, it is utilized to weed out the students whose parents failed to appear. Instead of regularly sending generic emails or messages to all the parents, this can let the teachers speak with those parents directly.
Schools and colleges must stay current with industry expectations in order to provide their students with relevant and enhanced courses as the level of competition in the field of education rises.
Colleges are having a difficult time keeping up with the growth of the industry, so to address this issue, they are implementing Data Science technologies to analyze market trends.
By utilizing various statistical measurements and monitoring techniques, Data Science may be useful for analyzing industry trends and helping course designers incorporate pertinent subjects. Predictive analytics may also be used by institutions to assess the need for new skill sets and design courses to satisfy those needs.
There are several instances of student disobedience or indiscipline in educational settings. A designated staff person is expected to log an entry into the system each time anything similar occurs.
Since each action should result in a different punishment, the course of action for each occurrence can be decided by evaluating the severity of the action. For the staff, analyzing all the records to assess the severity and avoid unfair punishment can be a time-consuming task. Natural language processing might help in this situation.
In a school that has been in operation for a while, there should be a large enough pool of log entries to draw from when building a severity-level classifier. The entire procedure will become automated if the teachers and disciplinary staff can see it as well, which will save them time.
The various applications of Data Science in education help us to evaluate that like many other industries. Data Science for students is also helping this sector attain new heights. Various advanced Data Science tools will help the institutions to enhance the learning outcomes, monitor all students along with improving the performance of the students.
So if you are planning to enter the Data Science industry then this is the best time as people have started to understand the importance of this sector now and the market is not yet saturated. But before you land your dream job in the Data Science niche, you will first need to understand the concepts and have a grip on the tools that are used in this industry. The ideal place to learn Data Science is Ivy Professional School. It offers great courses in Data Science and data engineering that you can enroll in. They offer expert-led courses along with complete placement assistance. Join Ivy and get to work on real-life Data Science in education case studies to make your resume more reachable to recruiters. For more details visit their website.
Team Jan 05, 2023 No Comments
It is difficult to monitor and analyze data from various sources. Best dashboard software concentrates data into a single place and you can evaluate KPIs) key performance indicators) via several filters. The display appears via charts, graphs, and tables. In this article, we will have a look at the top dashboard software comparison where we will compare the top three dashboard software and how it can help you build your data career. But before we get into the top dashboard software, let us have a look at its definition.
Dashboard software is an information management tool that tracks, collects, and presents company data in interactive visualizations that are fully customizable and allow users to monitor an organization’s health, examine operations, and gain useful insights.
When you are searching for a dashboard tool for visualizing data for your company, time-saving characteristics such as embeddability might be mentioned in your list. What about mobile BI and geospatial analytics?
Comparing contemporary BI tools may resemble navigating a maze; the more you learn about their characteristics, the more perplexing it becomes. This article will do a top dashboard software comparison. Also if you are looking for the best dashboard software for small businesses, then this is the ideal article for you. So without any further delay, let us begin.
Microsoft first published Power BI as an Excel add-on before releasing it as a SaaS service. It is now a stand-alone reporting and analytics solution for businesses of all sizes. It smoothly connects with other products from the vendor, including Office 365, because it is a member of the Microsoft family.
You may assess your company’s assets seamlessly from within business apps because it embeds readily. Effective querying, modeling, and visualization are made possible by its Power Query, Power Pivot, and Power View modules.
The free visuals that you may view online and download are what make Tableau so popular. With a high level of customization and programmable security features, it allows you total control over your data.
The drag-and-drop functionality and user-friendly UI make adoption simple. Although Tableau Desktop is the vendor’s main product, a license for Tableau Server or Tableau Online is included.
The traditional BI offering from Qlik, QlikView, assisted clients in making the transition from complex, IT-driven, SQL-centric technology to agile insight discovery. However, it can no longer be purchased. Since then, Qlik has unveiled Qlik Sense, a cutting-edge platform for self-service analysis. It supports a wide range of analytical requirements. They include:
Its Associative Engine examines each potential connection between datasets to unearth buried knowledge. The program can be installed locally as well as in private and public clouds. The seller offers Business and Enterprise, two subscription-based variants.
Now that you have got an idea about the top dashboard software, let us finally begin with the comparison based on individual features.
PowerBI:
It integrates with current on-premises and cloud analytics investments, particularly Microsoft ones. It integrates with current on-premises and cloud analytics investments, particularly Microsoft ones. It also supports a number of other systems, including Google BigQuery, Pivotal HAWQ, Hortonworks, Apache Hive, and Databricks Cloud. Information from Google Analytics, MySQL, Oracle, Salesforce, MailChimp, Facebook, Zendesk, and other sources can be combined.
Tableau:
It comes with built-in connections for Microsoft Excel, Amazon Redshift, Cloudera, Google Analytics, MySQL, and more, or you may make your own. Tableau falls short of Power BI in the area of third-party integrations. It only connects to platforms for project management, payment processing, business messaging, and online shopping through partner integrations.
Qlik Sense:
When comparing Qlik and Tableau, Qlik Sense has native connectors as well. Any that aren’t natively offered can be downloaded from the Qlik website. The latest sources that the vendor has added support for are the Databricks ODBC and the Azure Synapse connector.
However, it doesn’t support platforms for accounting, online commerce, or payment processing.
Verdict:
Power BI comes out on top. Although it lacks SAS connectivity, it makes up for it with additional sources and third-party connectors.
In this top dashboard software comparison, all tools offer end-to-end data management.
Power BI:
Its Query Editor allows the user to blend data with effective profiling. You can illustrate custom metrics via reusable data structures. The SSAS module of Microsoft for OLAP connects to sources in real-time.
Tableau Prep:
It is the exclusive offering of the vendor for data management. You can construct data workflows such as renaming and duplicating fields, filtering, editing values, and altering data types with its Prep Builder module. Prep Conductor helps in scheduling and monitoring this roadmap.
The top dashboard software comparison witnesses both coming through for OLAP. Tableau links seamlessly to Oracle Essbase, Microsoft Analysis Services, Teradata OLAP, Microsoft PowerPivot, and SAP NetWeaver Business Warehouse.
Qlik Sense
In terms of comparing Tableau with Qlik Sense, Qlik Sense mixes, transforms and loads data from several sources. AI recommendations, concatenation, and link tables can be used to find correlations.
By combining various data kinds, intelligent profiling produces descriptive statistics. The cognitive engine of Qlik automates process creation and data preparation. It offers suggestions for visualizations and connections.
Verdict
In the top dashboard software comparison, all three tools are tied for first place in data management.
Through interactive visualizations, Power BI, Tableau, and Qlik Sense offer visual data snapshots. For in-depth knowledge, you can filter and edit datasets. The most recent measurements are provided by periodic data refreshes.
Power BI:
You can have a preview of the underlying reports and datasets through its displayed metrics. Any report’s tile can be pinned to your dashboard, and the toolbar can be used to change the dashboard’s appearance. You can designate a dashboard as a favorite and set up alerts to track important indicators.
Although they are not included, dashboard templates are available through template apps. Animations are supported by Power BI, but only with end-user modification.
Tableau:
Tableau’s Dashboard Starters, which create dashboards after connecting to well-known sources, are more convenient when compared to Power BI. Create your own visualizations, or download and reproduce those created by the user base. By illustrating alterations over time, out-of-the-box animations improve visual presentations.
Qlik Sense:
View the performance of your company on important indicators with charts and graphs. Utilize the video player visualization in Qlik Sense apps to embed YouTube videos. There are animations available.
Verdict
When comparing Microsoft Power BI, Tableau, and QlikView for visualization, Qlik Sense and Tableau come out on top.
All three tools support planned and ad hoc reporting. You may easily create master item lists within bespoke apps using Qlik Sense to create reports. You must publish test workbooks on Tableau’s server before you can create reports in the program.
Power BI
Even inside a firewall, its Report Server’s strong governance mechanisms allow for the distribution of reports. Although the program doesn’t enable versioning, it does support permission management and role-based access. You can sign up for automatic report delivery that is configured to occur following the most recent refresh.
By merging with Narrative Science Quill, a third-party solution, it supports intelligent storytelling.
Tableau:
You may analyze data more quickly by using its Ask Data module to ask questions in natural language. Versioning is possible, allowing you to view what has changed since the previous version. Register to receive reports in PDF or image format via email.
Qlik Sense
Natural language searches are supported by its Insight Advisor module. There is no built-in mechanism for automatic report transmission; Qlik NPrinting is required. The Qlik Sense Hub also offers instant access to reports.
Versioning is supported by the tool, but with third-party integrations.
Verdict
Tableau wins the reporting comparison in the top dashboard software comparison, thanks to its built-in versioning and subscription-based report delivery.
When comparing Power BI, Tableau, and Qlik Sense, all of the tools provide in-memory analysis for high-speed queries.
Power BI
Live connections allow you to form reports from shared models and datasets and save them to your workspaces. The Query Editor allows over 350 transforms that include the remaining columns and tables, removing rows, setting the first rows as headers, and many more.
Batches update functionality is not built-in, but you can also do it via bulk operations.
Tableau
Through its visual query language, VizQL, you can easily query corporate assets. You can also append, mix, and aggregate particular datasets if you are familiar with SQL. Create unique live connections and make them available to others on the Tableau server.
Qlik Sense
When contrasting Qlik with Power BI, Qlik includes a Direct Discovery module for creating connections to live sources. Batch updates can be built-in. The Qlik Data Integration Platform updates data from live sources incrementally.
Verdict
As a result of its batch updates and effective visual querying, Tableau takes first place in this category.
Power BI
To keep track of users, it features an activity log. Additionally, the supplier bundles Office 365 with an audit log that records events from services like Sharepoint Online, Exchange Online, Dynamics 365, and others. The platform offers row, column, and object-level security, and it encrypts data both when it is in transit and when it is being processed.
Tableau
The manufacturer offers LogShark and TabMon as two open-source tools to evaluate the performance and usage of Tableau Server. By placing published dashboards behind logins, you can safeguard your live data.
Qlik Sense
Through Telemetry Logging, Qlik enables you to record CPU and RAM utilization along with activity measurements. The Content Security Policy (CSP) Level 2 stops injection attacks and Cross-Site Scripting (XSS). An additional layer of protection is provided via MFA (Multi-Factor Authentication) and API-based key configuration.
The tool allows row and column-level security via a section access login and encryption only at rest.
Verdict
When comparing Microsoft BI, Tableau, and Qlik Sense for information security, Power BI comes out on top.
Power BI
It offers vizualization based on the location that can be pinned to dashboards by incorporating ArcGIS Maps, Bing Maps, and Google Maps. Or visuals can be created based on TopoJSON maps. Geospatial operations and calculations are accessible via Power Query or Data Analysis Expressions.
Tableau
One can do advanced spatial analysis in Tableau by mixing geodata files along with spreadsheets and text files. It provides revInstead, it leverages Qlik’s GeoAnalytics connector, the GeoAnalytics Server and other extensions. erse and forward geocoding natively. Reverse geocoding offers valuable location insight for delivery and fleet tracking. IoT (Internet of Things), data and photo enrichment, and payment processing.
Qlik Sense
It doesn’t offer to geocode, geospatial functions, WMS integration, and spatial file support. Instead, it makes use of the GeoAnalytics Server, Qlik’s GeoAnalytics connection, and other add-ons. Another add-on that enhances the tool’s geolocation capabilities is Qlik Geocoding.
Verdict
Tableau leads the pack with its robust map search feature, interactive visualizations, and geospatial interfaces in a range of formats.
Power BI
Regardless of whether your data is on-premises or in the cloud, get safe access to live reports and dashboards when you’re not at the office. You can form reports on your mobile, set up alerts, and ask queries. Share the report and the dashboard and collaborate with others via comments. Annotations, and also @mentions.
Tableau
Its mobile application allows the user to search, browse, and scroll through dashboards on their mobiles. The user can also preview their visualizations and also their workbooks and interact with them when they are offline.
Qlik Sense
The user can access the Qlik Sense application and mashups on mobile along with all other characteristics such as creation, visualization, analysis, administration, and collaboration. Add context to analytics along with a convincing narrative and form active discussions that revolve around business assets through collaboration.
Verdict
Due to its powerful mobile intelligence features, Power BI takes first place in this category.
In conclusion, Power BI wins in maximum parameters making Qlik Sense grab the second position. When all is said and done, the winning option might not be the best one for you. Nevertheless, this feature-to-feature comparison should help you determine the qualities to seek in a BI application. Software pricing varies depending on the feature set, add-ons, and deployment style, even if cost is a major consideration.
But just having gotten these top dashboard software will not solve your issue. You need to know how to use this software. This software is specifically used in the data industry and if you wish to enter this industry, you need to know these tools. The best institute that offers courses on data analytics and data science is Ivy Professional School. It offers great courses in data science and data engineering that you can enroll in. They offer expert-led courses along with complete placement assistance. Join Ivy and get to work on real-life insurance data science projects to make your resume more reachable to recruiters. For more details visit their website.
The three top dashboard software are Power BI, Tableau, and Qlik Sense.
Top dashboard software includes Power BI, Tableau, and Qlik Sense.
Domo is not your typical dashboard application. Because Domo’s dashboards are built on its platform, your data is always current.
Team Dec 29, 2022 No Comments
It is not surprising that Data Science is growing rapidly and is expected to reach a market worth USD 350 billion by the end of 2022. The hierarchy has been divided into many categories, such as Data Scientists, Data Analysts, Data engineers, etc., and they are monopolizing the IT sector as a result of the increasing demand and speed. This article will act as a roadmap for Data Analysts.
As per the recent survey, it was found that the market was unsuccessful in fulfilling the demand for Data Analysts for the past couple of years and is the reason people are shifting their careers into the Data Science niche because of the major attraction that this niche offers which is growth and salary opportunities.
These easy steps will help you in building your career in Data Science. Data Science is no rocket, you just need to follow a few steps and be dedicated to achieving what you wish. Then becoming a Data Analyst is just a matter of a few months. So without any further delay let us begin with the roadmap for Data Analyst.
It is very crucial to have your basics ready. The Data Science industry is all about understanding and if you have that, you are almost there. To create a solid foundation, the first step you will have to take is to enroll in a good data analytics course. Learning the basics will help you a lot in your career. Along with this if you get the chance to practice on some real-life industry-level projects then that will help you more. In this respect, we would take some time to tell you about Ivy Professional School. This is a data analytics institute that offers industry-relevant courses along with real-life projects and placement assistance. Ivy understands the importance and scope of Data Science in the present market scenario and creates its courses accordingly. Their courses are led by industry experts and help a lot in enriching your resume with real-life projects.
This is one of the most crucial steps in this roadmap for Data Analyst. As stated above, working on real-life projects will increase the weightage of your resume and will also help you in building confidence. There are a few ways to work on real-life projects:
Here are some of the examples that you can consider in creating your project.
Connect and network with like-minded people on Twitter, LinkedIn, or any other social media site you want. For instance, building relationships in this way should be your strategy if you want to improve as an analyst.
Let the Data Science industry know you. Showcase your projects on various social media handles. There are a few points to keep in mind while you share your projects.
When you have the above-mentioned steps, you can start to apply for jobs. The best thing about the Data Science field is that you can apply for jobs based on specific tools. So suppose you opt for Data Science With Vizualization certification course at Ivy, you can apply for the tools like Excel, or Power BI once they are completed individually. So this is the benefit that this industry offers.
There are various portals from where you can apply such as LinkedIn, Naukri, Indeed, and many more. But the best among them is LinkedIn. It offers wide exposure to all the spheres of recruitment. Here are some ways by which you can look for jobs in the Data Science domain:
With this, your roadmap for Data Analyst ends. Follow these steps with determination and smart work to achieve optimum results.
Today, billions of businesses produce data every day and use it to inform important business choices. It aids in determining their long-term objectives and establishing new benchmarks. In today’s world, data is the new fuel, and every industry needs Data Analysts to make it useful. The market share of Data Analysts is expected to increase by USD 650+ billion at a CAGR of around 13%, making it one of the most sought-after professions in the world. The more data, the greater the need. So if you are planning to make your career in data analytics then it is indeed the best choice. Hope this roadmap for Data Analyst helped you. You can also get free 1:1 career counseling to clear all your doubts regarding this industry. For.. more details visit Ivy’s official website.
Team Dec 26, 2022 No Comments
One of the most competitive and unpredictable business sectors is the insurance sector. It is highly related to risk. As a result, statistics have always been a factor. These days, data science has permanently altered this dependence. In this article, we will give you an insight into the various use cases of data science in insurance industry.
The information sources available to insurance firms for the necessary risk assessment have expanded. Big Data technologies are used to anticipate risks and claims, track and evaluate them, and design successful client acquisition and retention tactics. Without a doubt, data science and insurance easily compliment each other. In this article, we will have a look at the top 10 data science use cases in insurance.
Insurance companies are presently undergoing rapid digital transformation. With insurance digital transformation, a broader range of data is available to insurers. Data science in life insurance enables companies to assemble these data to effective use to drive more business and filter their product offerings. With that, let us have a look at the various applications of data science in insurance industry.
The first case among the various data science insurance use cases is the detection of fraudulent activities. Every year, insurance fraud costs insurance companies a great deal of money. It was able to identify fraudulent activities, suspicious relationships, and subtle behavioral patterns utilizing a variety of methods thanks to data science platforms and software.
A steady stream of data should be provided into the algorithm to enable this detection. Generally, insurance companies employ statistical frameworks for effective fraud detection. These frameworks depend on previous instances of fraudulent actions and use sampling methods to evaluate them. Along with that, predictive modeling techniques are used here for the purpose of analysis and also filtering of fraud scenarios. Evaluating connections between suspicious activities allows the company to identify fraud schemes that went unnoticed previously.
Customers are constantly eager to receive individualized services that completely suit their demands and way of life. In this regard, the insurance sector is hardly an exception. To satisfy these needs, insurers must ensure a digital connection with their clients.
With the aid of artificial intelligence and advanced analytics, which draw insights from a great quantity of demographic data, preferences, interactions, behavior, attitude, lifestyle information, interests, hobbies, etc., highly tailored and relevant insurance experiences are ensured. The majority of consumers like to find deals, policies, loyalty programs, recommendations, and solutions that are specifically tailored to them.
The platforms gather all relevant data in order to identify the primary client needs. Then, a prediction of what will or won’t work is made. Now it’s your turn to either create a proposal or select the one that will work best for the particular customer. This may be done with the aid of the selection and matching methods.
The personalization of policies, offers, pricing, messages, and recommendations along with a continuous loop of communication hugely contributes to the rates of the insurance company.
The idea of price optimization is complicated. As a result, it employs multiple combinations of different techniques and algorithms. Even though using this process for insurance is still up for debate, more and more insurance firms are starting to do so. This procedure entails merging data unrelated to predicted costs, risk characteristics, losses and expenses, as well as further analysis of that data. In other words, it considers the modifications compared to the prior year and policy. Price optimization and customer price sensitivity are so strongly related.
A qualitatively new level of product and service advertising has been reached thanks to modern technologies. Customers typically have different expectations for the insurance industry. Various strategies are used in insurance marketing to boost customer numbers and ensure targeted marketing campaigns. Customer segmentation emerges as a crucial technique in this regard.
According to factors like age, geography, financial sophistication, and others, the algorithms segment customers. In order to categorize all of the clients, coincidences in their attitudes, interests, behaviours or personal information are found. This categorization enables the development of solutions and attitudes especially relevant to the specific user.
CLV (Customer lifetime value) is a complicated factor portraying the value of the user to an entity in the form of the variation between the revenue gained and the expenses made projected into the whole future relationship with a user.
To estimate the CLV and forecast the client’s profitability for the insurer, consumer behaviour data is often used. The behaviour-based models are so frequently used to predict cross-selling and retention. Recency, the monetary value of a customer to a business, and frequency are seen to be crucial variables when estimating future earnings. To create the prediction, the algorithms compile and analyse all the data. This makes it possible to predict whether customers will maintain their policies or cancel them based on their behaviour and attitudes. The CLV forecast may also be helpful for developing marketing strategies because it puts customer insights at your disposal.
Healthcare insurance is a broad phenomenon across the globe. It generally implies the coverage of costs created by the accident, disease, disability, or death. In many nations, the policies of healthcare insurance are effectively supported by the governing bodies.
In this era of quick digital data flow, this niche cannot resist the influence of various data analytics applications. The global healthcare analytics market is constantly evolving. Insurance companies suffer from continuous pressure to offer better services and decrease their costs.
A broad range of data that includes insurance claims data, provider data and membership, medical records and benefits, case and customer data, internet data, and many more are assembled, framed, processed, and turned into valuable results for the healthcare insurance business. As a result, factors like cost savings, healthcare quality, fraud protection and detection, and consumer engagement may all greatly improve.
The future forecast piques the interest of insurance firms greatly. The potential to lessen the company’s financial loss is provided by accurate prediction.
For this, the insurers employ some complicated procedures. A decision tree, a random forest, a binary logistic regression, and a support vector machine are the main models. In order to reach all levels, the algorithms implement high dimensionality and incorporate the detection of missing observations as well as the discovery of relationships between claims. The portfolio for each customer is created in this way.
When talking about data science for insurance, we can conclude that modern technology is advancing quite quickly and entering many different industries. The insurance sector does not lag behind the others in this regard. Statistics have long been used in the insurance industry. Therefore, it is not unexpected that insurance companies are utilizing data science analytics in a big way.
The goal of using data science in insurance is much the same as it is in other industries: to improve the business, increase revenue, and lower expenses.
By now you must have understood the benefits data science has in the insurance sector. And not only in the insurance sector, but data science also finds relevance in almost all sectors of the world. So if you are aiming for a career as an insurance data scientist then this is the time. But before you enter this industry, it is important for you to grab a certificate in the same. Ivy Professional School offers great courses in data science and data engineering that you can enrol in. They offer expert-led courses along with complete placement assistance. Join Ivy and get to work on real-life insurance data science projects to make your resume more reachable to recruiters. For more details visit their website.
There are various applications of data science that include Claim Prediction, Healthcare Insurance, Lifetime Value Prediction, Customer Segmentation, Price Optimization, Personalised Marketing, and Fraud detection.
Using a plethora of data that is presently available, the insurance industry is seeing immense growth. Data anticipate how the industry will operate and also how its relation will be with its customers.
The job role of a data analyst in the insurance industry is to extract, convert, and summarise data as input for studies and reports, and data analysts design, alter, and run computer programmes. Examine the accuracy of the data that insurance firms offer, both in transactional detail and in aggregate, and assist the companies in fixing mistakes.
Team Dec 15, 2022 No Comments
The varied use of big data in all sectors of our life from transportation to commerce makes us realize how crucial it is in our daily lives. In the same way, data science is transforming the healthcare sector. In this article, we are going to have a look at how data science in healthcare can bring about a big and distinctive change.
Nearly 3.5 billion US dollars have been invested in digital health startups and in healthcare data science projects in 2017 enabling companies to meet their ambition of revolutionizing the general notion of healthcare that the world carries. If you are aiming to pursue a career in data science in the healthcare domain, then this is the ideal article for you as you will find many data science in healthcare jobs.
There are numerous factors that make data science crucial in healthcare in the present time, the most crucial of them being the competitive demand for important data in the healthcare niche. The collection of data from the patient via effective channels can help offer enhanced quality healthcare to users. From health insurance providers to doctors, all of them depend on the collection of factual data and its exact analysis to make effective decisions about the health situations of the patients.
Nowadays, diseases can be anticipated at the earliest stage with the help of data science in healthcare, that too remotely with innovative appliances boosted by ML (Machine Learning). Smart devices and mobile applications constantly assemble data about blood pressure, heartbeat rates, sugar, and so on transferring this data to the doctors as real-time updates, who can structurize treatments accordingly.
The significant contribution of data science in the pharmaceutical industry is to offer the groundwork for drug synthesis using AI. The metadata of the patient and mutation profiling is used for developing compounds that point towards the statistical correlation between the attributes.
Presently, AI platforms and chatboxes are structured by data scientists to allow people to get a better evaluation of their health by putting in several health data about themselves and getting a precise diagnosis. Along with that, these channels also assist users with health insurance policies and guide them to a better lifestyle.
The present-day scenario of the IoT (Internet of Things), which assures optimum connectivity is a blessing of data science. Presently, when this technology is applied to the medical arena, it can help supervise patient health. Presently, physical fitness supervises and smartwatches are used by people to manage and track their health. Along with that, these wearable sensor devices can be monitored by a doctor if they are given access and in chronicle cases, the doctor can remotely offer solutions to the patients.
Data scientists have developed wearable devices for public health that will allow doctors to collect most of the data such as sleep patterns, heart rates, stress levels, blood glucose, and even brain activity. With the help of various data science tools and also machine learning algorithms, doctors can track and detect common scenarios such as respiratory or cardiac diseases.
Data science technology can also anticipate the slightest alterations in the health indicators of the patients and anticipate possible disorders. Several wearables and also home devices as a part of an IoT network employ real-time analytics to anticipate if a patient will encounter any issue based on their current scenario.
A crucial part of medical services, diagnosis can be made more convenient and quicker by data science applications in the healthcare domain. Not only does the data analysis of the patient boosts early detection of health problems, but medical heatmaps pertaining to demographic patterns of issues can also be made.
A predictive analytics model uses historical data, evaluates patterns from the data, and offers precise predictions. The data could imply anything from the blood pressure and body temperature of the patient to the sugar level.
Predictive models in data analytics associate and correlates each data point to symptoms, diseases, and habits. This allows the identification of the stage of the disease, the extent of damage, and the appropriate treatment measure. Predictive analytics in the healthcare domain also helps:
Healthcare professionals seldom use several imaging technologies such as MRI, X-Ray, and CT Scan to visualize the internal system and organs of your body. Image recognition & deep learning technologies in health Data Science enable the detection of minute deformities in these scanned pictures, allowing doctors to plan an impactful treatment strategy.
Along with that, health data scientists are continuously working on the development of more advanced technologies to improve image analysis. For instance, the latest publication in Towards Data Science, the Azure Machine Learning channel can be used in training and optimizing a structure to detect the presence of three common brain tumors, Meningioma tumors, Glioma tumors, and Pituitary tumors.
As a data scientist in the healthcare and pharmaceutical industry, you will have to use your analytical skills to diagnose illness precisely and save lives. The huge amount of data that is sourced from the healthcare niche, from patient data to records kept by government authorities need a skilled analyst to handle it all.
The Covid-19 pandemic has lately shown how important data science in healthcare can be. Not only has data science enhanced the sampling and collection of data but also demonstrated global patterns in the spread of the infection, anticipating the next region where Covid would spread and how government policies can be structured to fight against the contagious disease effectively.
Regarding national-level healthcare, data scientists can help in monitoring the spread of the disease within the nation and coordinate in accordance with the authorities to send resources to the most affected areas.
In this section, we will outline the important responsibilities of a healthcare data scientist:
Evaluating the role of data science in healthcare is also an important responsibility for a data scientist in the healthcare domain. It includes modifying assembled data to align with the objectives and aims of the company.
Here are some of the top advantages of data science in healthcare that you can think of:
Perhaps the most crucial utilization of data science in healthcare is to decrease errors in the process of treatment via accurate anticipations and prescriptions. Since a substantial portion of data about the medical history of the patient is collected by the data scientists, that stored data can be employed for identifying symptoms of illness and offering a precise diagnosis. Mortality rates have significantly decreased since treatment options may now be tailored and care is given with better knowledge.
The development of medicine needs intensive research and time. However, both effort and time can be decreased by medical data science. Via the usage of case study reports, lab testing results, and previous medical and the impact of the drugs in clinical trials, machine learning algorithms can anticipate whether the drug is going to offer the desired impact on the human body.
In the case of quality treatment that needs to be taken care of, it is essential to create skill sets that can offer a precise diagnosis. Using predictive analytics, one can anticipate which patients are at greater risk and how to get in early to prevent serious damage. Along with that, the huge quantity of data requires to be managed skillfully to stop errors in administration, for which data science can be an ideal solution.
EHRs (Electronic Health Records) can be used by data science specialists in the medical arena to identify the health patterns of patients and stop unnecessary hospitalization or treatments, thus decreasing costs.
The 21st century is making lucrative use of data science in the healthcare niche to boost surgeries, operations, and patient recovery procedures. Apart from the developments in technology and the raised digitization of lifestyles, data science will also help in decreasing healthcare expenses, making quality medical amenities accessible to everyone.
We can conclude that there are various applications of data science in healthcare. The pharmaceutical and healthcare industry has heavily used data science for enhancing the lifestyles of patients and anticipating diseases at an early stage.
Along with that, with the advancements in medical image analysis, it is possible for doctors to find microscopic tumors that were previously difficult to find. Hence, it can be concluded that data science has revolutionized the healthcare sector and also the medical e
Now come to the section, where we can talk about how you can take your data science career to the next level. To establish your career in data science in the healthcare section you will have to have some sort of certification. The best institute for Data Science in this country is Ivy Professional School. Ivy offers a range of certifications that will help you in the future.
Team Dec 13, 2022 No Comments
AI is set to break all barriers. Now bots can answer all your questions in just a few seconds. If you are a tech-savvy person, by now you are aware of the latest ChatGPT 4 by OpenAi. ChatGPT is a newly launched application from OpenAI that is offering its users amazing answers to all their questions.
ChatGPT app is a highly advanced chatbot created by OpenAI. It is an AI research company that is behind products like the Dall E2 image generator and GPT3 which is the text model. This latest release which is in its beta version blew up the AI industry. People beyond this industry are actually talking about the ChatGPT 4. This AI bot has drawn interest while in its testing stage because of the high potential that it carries.
In 2020, OpenAI released ChatGPT3, which too gained a good push from the audience. But the GPT 4 is a bit different from its predecessor. It is more conversational in nature. The dialogue format makes it possible for ChatGPT 4 to follow up on questions, admit mistakes, challenge incorrect answers, and reject inappropriate requests. So, we can say that this is a sibling model to instruct GPT which is a subset of GPT 3.
In easy terms, ChatGPT is basically a chatbot where the users can ask questions and the chatbot uses AI (Artificial Intelligence) to give answers. OpenAI created this bot so that users can get both technical and non-technical responses.
ChatGPT as mentioned above is a chatbot that uses deep learning to offer text that resonates with a human and is created on GPT 3.5 language structure. This bot can respond to several questions in a natural way similar to a personal tutor, who is sound about all the subjects. But can this be called an alternative to Google, still remains a question n With that, let us have a look at some of the important features of ChatGPT 4?
This application which is trained by Artificial Intelligence and Machine Learning can offer information and answer questions via a conversation. If you are wondering how to use ChatGPT, below are the steps by which you can access ChatGPT.
ChatGPT is presently a prototype. At times it writes reasonable-sounding but factually incorrect answers. Along with that, ChatGPT seldom overuses several phrases like restating that it is a language structure trained by OpenAI. At times, it responds to harmful instructions, exhibits biased behavior, and also responds to inappropriate requests.
Recognizing the limitations in its present form, CEO of OpenAI Sam Altman posted on Twitter stating,
“…a lot of what people assume is us censoring ChatGPT is in fact us trying to stop it from making up random facts. Tricky to get the balance right with the current state of the tech. It will get better over time, and we will use your feedback to improve it.”
It was created by San Francisco-based OpenAI. A firm that also produced this year’s ground-breaking picture generator DALL-E 2 and tools like GPT-3.
A chatbot is a piece of software created to replicate human-like discussions in response to user input.
To test out ChatGPT, one can visit the OpenAI website and register. To use this service, you must register for an account with OpenAI. You might receive a notification stating that the beta is filled because the chatbot has already attracted one million users.