Team Jul 27, 2022 No Comments
The lives of individuals, businesses, and industries have been devastated by Covid-19. The world came to a halt in 2020 and has started to resurrect itself in a completely new dimension. The Covid-19 pandemic shows the vital necessity for fast and reliable data sources that are both individualized and population-wide to generate data-driven insights into disease surveillance and control, because of its tremendous consequences on global health and economics. This is where data science comes in. The impact of data science post covid is huge.
Every company benefits from data science post covid With the increasing complexities and shifting needs of customers, data is becoming increasingly important. Data Science combines programming, mathematics, and statistics ability to develop data-driven insights using statistical figures, patterns, and trends. Because they are unable to function according to their initial business goals, the present Covid-19 situation has added to the complications for businesses.
Covid-19 has broken the historical analytics paradigm so significantly, according to McKinsey, that pre-Covid data must be viewed in a separate historical context. The quick breakout of the pandemic compelled organizations to make a sudden jump to accommodate the changing requirements of the moment. However, other businesses and sectors adapted successfully to the circumstance by developing new data science procedures that could be implemented much more quickly. As entire operations had to be moved to a completely remote and wireless platform, the following trends were expected to be observed in Data Science trends.
• More technology-driven research.
• More connected infrastructure.
• Brands attempting to keep up with the fast-paced digital maturity required to stay relevant and competitive.
Data science volume utilizes large volumes of data to make an informed decision regarding business. It is basically a study to formulate new products. Typically, data analysts analyze data and find new insights. They support companies in making progress with gathered data. Modern data analysts can be called part mathematicians, part computer scientists, and also part trend spotters. They operate in advanced ML (Machine Learning) frameworks and are aware of the technicalities to anticipate future customers or market behavior dependent on previous trends.
The goal of businesses from data analysts is to make decisions that are data-driven for a powerful business impact. Demand for data scientists is relatively high with great opportunities to evolve. However, with the latest coronavirus pandemic, there was a bit of flattening out of the demand. Currently, after two years of the pandemic, there are no indications of a decrease in the demand for data scientists and a slowing down of data science.
With evolving data, the requirement for data analysis and making sense of the assembled data is also rising. Hence, there is no such thing as data science post covid. There is a sky-high pay and evolving demand for data scientists in several companies. It has resulted in a serious upward career arc.
The role of Data Science has become all the more important after the Covid-19 crisis. For example, industries that have incurred losses will adopt more aggressive business approaches to improve sales and better understand the needs of the customers. Economic and everyday life disturbances can force any company to make considerable changes in order to stay competitive. And that is what has happened with the pandemic. Companies started using Data Science to their advantage in the following ways.
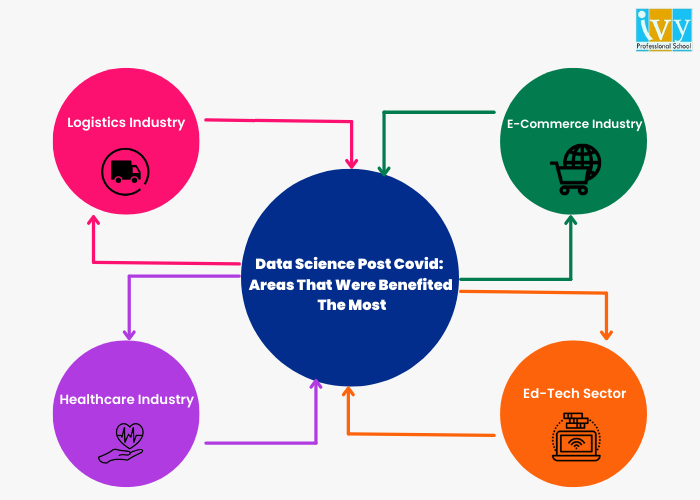
The key areas where data science has gained paramount importance post-Covid 19 are as follows.
The logistics industry went through a massive change post-Covid and Data Science has a significant role to play in it.
The AI model data helps companies understand different kinds of scenarios and limitations such as geographical restrictions that may be in effect due to rising Covid-19 cases.
Predictive analytics is a significant application of Data Science in healthcare. The predictive model examines and learns from historical data, identifying trends and making predictions based on them.
Individuals use the digital space in healthcare to explore better services and delivery because the risk of visiting a hospital during Covid-19 is very high. In healthcare, data science assists hospitals in identifying many symptom connections among a group of users on health portals. By creating records, hospitals can improve special care. They can also improve supply chain efficiency to improve patient outreach.
People used to go to malls to shop and eat at restaurants a few years ago. Customers began to shop from online platforms at their leisure after the Covid 19 outbreak, avoiding the risk of contracting the virus.
People are now able to purchase products of their choice from the comfort of their own homes, and artificial intelligence is presenting them with an experience akin to that of a physical visit. Customers of online shopping platforms receive a customized experience based on their data profiles.
The industry shifted most of the world into emergency remote learning settings after Covid-19 hit the world and led to the temporary closure of schools and educational institutes. Educational Institutions around the world shifted to video conferencing capabilities, online learning management software, and other digital alternatives.
The use of software and data science in the education industry to predict the use and effectiveness of delivery systems is still improving. Data science aids in determining the total impact of existing tools and software, as well as maximizing the use of technology to enhance the learning experience.
The effect of AI (Artificial Intelligence) on the economy and on our lives has been quite astonishing. There are countless instances and applications of AI. Expectations from AI are human-like and the artificial intelligence technologies are categorized into sense, comprehend, and act. The machine must perceive and sense the data via audio-visual processing. It must identify the pattern and evaluate the data as a pattern or context. AI must allow the machine to obtain potential insights that can support actions.
One of the prominent challenges in adopting AI is privacy. AI operates on a huge volume of confidential data. The data is seldom sensitive and personal. Unclear security, privacy, and ethical regulations formulate a plethora of challenges. In some nations, the General Data Protection Regulations (GDPR) act adds further obstacles to the adoption of AI. Along with that, AI requires highly trained and skilled professionals. Scarcity of awareness of the adoption of AI in businesses, technology, infrastructure, and research poses further issues. However, entities and businesses are aggressively adopting AI and aiming at diversifying it.
As a result, the post-COVID-19 age presents a chance for the next generation of data scientists. Data science post covid witnessed immense popularity and significance. However, data scientists must drastically improve their skills to advance to the next level. There are various opportunities to upskill and make a career in the field of Data Science. When it comes to Data Science, one institute that deserves a special mention is Ivy Pro School.
Since 2008, Ivy Professional School has continuously ranked among the top data science and analytics training institutions. Ivy has well-accomplished faculty with more than ten years of industry experience. It aims to provide specific learning experiences that organizations are looking for in their prospective data science candidates.
Team Jul 22, 2022 No Comments
How do you think you get product recommendations on an E-commerce site or how do you think taxi booking services monitor traffic conditions and adjust prices accordingly? The answer is “Data Science”. With technological advancements and growing changes in the world of business, Data has become of paramount importance to industries, corporate houses, and government sectors. This is where the science behind data comes in. Here is an easy data science guide for you.
In simple words, Data Science is the field of study that deals with huge volumes of data using new-age techniques and tools. It finds patterns and derives meaningful insights from the vast amount of unstructured data and helps businesses make informed decisions. The data that is analyzed comes from various sources and is presented in different kinds of formats. Data Science comprises various tools, machine learning principles, and algorithms that assist in discovering hidden patterns from the available raw data.
Earlier, the data that we had was mostly structured and very small in size and therefore it was easier and simpler to analyze it. In recent times, the data generated from various sources is mostly unstructured or semi-structured. This cannot be analyzed or processed with simple BI tools. To analyze and draw insights from these data obtained from text files, multimedia forms, financial logs, and instruments, more complex and advanced analytical tools are required. This is the reason why Data Science is gaining so much popularity these days.
The usability of data science is huge. It is used in almost all sectors and is given utmost importance. Especially, in post covid era, the use of data science has increased. This infographic will give you a gifted idea of the areas where data science is sued.
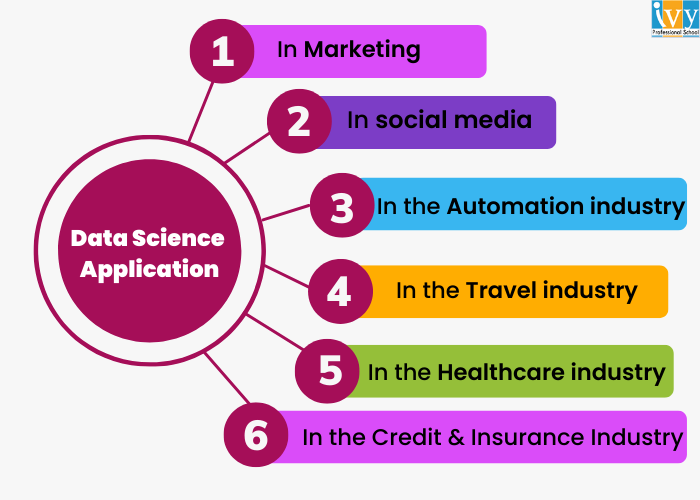
Let us now examine how Data Science is being used beneficially across multiple fields and sectors.
• In Marketing, Data Science is used for getting valuable customer insights, real-time interactions, customer segmentation, targeting, cross-selling, and predicting the lifetime value of a customer.
• In Sales, Data Science is used for future sales prediction, discount offers, etc.
• In social media, Data Science is used for measuring marketing performance KPIs, monitoring the effectiveness of campaigns, creating personalized ads, sentiment analysis, and much more.
• In the Automation industry, Data Science is used for self-driven cars.
• In the Travel industry, Data Science is applied to predicting flight delays and dynamic pricing.
• In the Healthcare industry, Data Science is applied for medication effectiveness and the prediction of diseases.
• In the Credit & Insurance Industry, Data Science detects fraud and risks and is also used for claims prediction.
In this data science guide, it is crucial that we look into the job profile of a data scientist. Data Scientists are those who crack complicated data issues along with the strong expertise in several scientific disciplines. They operate with various elements associated with mathematics, computer science, statistics, and many more. They make a lot of utilization of the latest technologies in finding solutions and attaining conclusions that are important for the development and growth of an organization. Data scientists offer the data in a much more effective and useful format in comparison to the raw data that is available to them in structured along with the unstructured forms. All data scientists should hold a data science degree.
The Data Science profession is challenging but fortunately, many tools make the job of Data Scientists easier. Some of the tools include MATLAB, Excel, SAS, Jupyter, Tableau, Cognos, R Studio, RAW, Azure ML studio, and much more. Owing to the increasing demand for the subject in the industry, there is a rising need for more and more professionals to have in-depth knowledge about Data Science. Data Science jobs are not only high paying but are also in demand. There are many definitions available for Data Scientists. A very common definition of Data Scientists is that they are people who know the art of Data Science. They crack complex problems with their knowledge and work with several elements like mathematics, computer science, statistics, etc. Data Scientists offer data in a useful way. Data Scientist experts are needed in every sector and tech company. They are highly educated and are in demand these days. The various Data Science job options are Data Scientist, Machine Learning Engineer, Machine Learning Scientist, Application Architect, Enterprise Architect, Data Engineer, Data Engineer, and much more.
The process of analyzing and acting upon data isn’t linear and the Data Science lifecycle flows in the following ways.
• Defining a project and its potential outputs.
• Exploring, pre-processing, and conditioning the data before modeling. Data Scientists need the right tools and access to the right data.
• In this phase, model planning is done where one needs to determine the techniques and methods to draw a relationship between two variables. Various common tools are used for model planning.
• In this phase, Data Scientists develop datasets for training and testing purposes. Various learning techniques are analyzed to build the model.
• In this phase, final reports, briefings, and technical documents are delivered. A pilot project is executed at this stage.
• In this phase, the results are communicated to the stakeholders.
There are many Data Science guide courses available that will help you build a successful career in the field of Data Science. However, it is very important to pursue the course from the right place. Ivy Professional School is the pioneer in Data Science and has committed to providing in-depth subject knowledge to the students to make them professionally competent. Ivy Pro School’s collaboration with NASSCOM will unlock great opportunities for Data Science candidates and help them build the career of their dreams. The Data Science course at Ivy Pro School includes high-demand tools like Python, R, Tableau, SQL, Adv Excel, VBA, etc. So if you are interested in building your skills in the field of Data Science, the best way to learn data science is with us. Hope this guide about data science for beginners helped you.
1. Can I self-learn data science?
One can learn data science on their own with online data science courses or also even from YouTube videos. There is no paucity of learning materials on the internet if one is working towards a career in this field. Having said that, self-learning lacks structure, and one might not know what crucial elements one is missing.
2. What is data science A Beginner’s Guide to data science?
In simple words, Data Science is the field of study that deals with huge volumes of data using new-age techniques and tools. It finds patterns and derives meaningful insights from the vast amount of unstructured data and helps businesses make informed decisions.
3. What are the basics needed for data science?
In Marketing, Data Science is used for getting valuable customer insights, real-time interactions, customer segmentation, targeting, cross-selling, and predicting the lifetime value of a customer.
Team Jul 20, 2022 No Comments
Data analytics is all about collecting and analyzing raw data to find valuable patterns and insights that answer questions or solve problems. This helps businesses make smart decisions, improve efficiency, increase customer satisfaction, and drive more revenue.
If you want to master data analytics, you must know the different types of data analytics employed in industries. So, in this post, we will discuss the four main data analytics types in detail with examples. You will understand what they are, how they differ from each other, and why they are important.
There are four main types of data analytics: descriptive, diagnostic, predictive, and prescriptive analytics. Each of them answers a certain question that helps businesses better understand the past, present, and future and take smart actions to achieve their goals. Let’s understand them in detail:
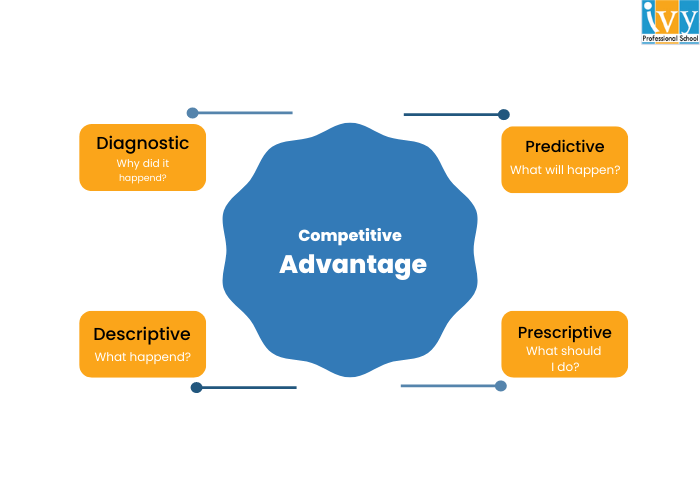
Descriptive analytics is the most basic type of data analytics currently used. It analyzes historical data to find out what has happened in the past or what is happening in the present.
It uses various techniques such as data aggregation, data mining, and reporting to spot patterns and trends over time. It may use arithmetic means to show an average of the values or frequency distribution to show how often a value occurs in the dataset.
Descriptive analytics uses visualization techniques like creating charts and graphs to visually represent complex data, making it easy to identify trends.
Examples of Descriptive Analytics
Let’s say you run an online store, and you want to know how much you sold in the last six months. So, you will use descriptive analytics to analyze monthly sales data and find peak sales periods and underperforming months. You can also identify top-selling products.
Similarly, businesses can use descriptive analytics to analyze:
Diagnostic analytics helps us go further than descriptive analytics. Now that we already know what has happened, diagnostic analytics helps us answer the valuable question, “Why did it happen?” That means we understand the cause of the trends and patterns we just found in the descriptive analytics.
You may use different methods like drill-down analysis, correlation analysis, Pareto analysis, fishbone diagram, hypothesis testing, etc., to effectively understand the cause of an event. This way, businesses can identify areas of improvement and make better strategies.
Examples of Diagnostic Analytics
Let’s say in the above sales report, you found that a particular month had significantly low sales. So, you use diagnostic analysis and find the cause: you had low product stock and couldn’t meet the customer demand effectively.
Similarly, businesses may use diagnostic analytics to find out:
When you know the problem and why it’s happening, you will be able to find effective solutions to make things better. Now, let’s move to our third type of data analytics:
Related: Data Scientist vs. Data Analyst
Now, we are getting into advanced analysis. Predictive analytics uses historical data, statistical models, and machine learning algorithms to figure out what may happen in the future. It can predict future events, trends, outcomes, and behaviors that may affect the business performance.
Techniques used in this type of data analytics can be time series analysis to identify patterns, regression analysis to identify relationships between variables, or decision trees to represent the decision-making process and predict outcomes. The idea is that once you know what will happen, you can better prepare for the challenges and get ready to take advantage of opportunities.
Examples of Predictive Analytics
Coming back to our online store example, let’s say you found that you had low sales because of an inventory shortage. Now you want to fix this problem. So, you may use predictive analytics to forecast the demand for various products. This way, you can have optimal inventory levels to meet the demand, avoiding inventory shortage as well as overstocking.
Predictive analytics can also be used to:
This is the most advanced type of data analysis that combines descriptive, diagnostic, and predictive analytics. It helps us find out what actions we should take to avoid an undesirable outcome or achieve a desirable outcome.
So, the goal of prescriptive analysis is to provide actionable recommendations. It may use techniques like optimization modeling to find the best solution with given constraints, simulation to evaluate different scenarios, or artificial intelligence techniques to automate decision-making processes.
Examples of Prescriptive Analytics
You used predictive analytics to find the demand forecasts. Now, prescriptive analytics goes further by recommending specific actions to achieve the maximum sales. It suggests how to optimize inventory based on predicted demand, supply chain factors, and business goals. You will also know how much inventory to order and when to order it.
You can also use prescriptive analytics to find actionable insights for these questions:
Now you know the four types of data analytics and how they depend on each other. The goal of data analytics is to help businesses identify areas for improvement, increase efficiency, and enhance processes. That’s why data analysts are in demand in the current industry.
If you want to be a data analyst, you can join Ivy Professional School’s Data Analytics Certification course. This is a live online program taught by industry professionals from IIT, IIM, and US universities. You will learn to use tools like Excel, SQL, Python, R, and Tableau with 50+ assignments, 30+ case studies, & 10+ industry projects. Visit this course page to learn more about it.

Eeshani Agrawal holds an MS in Civil Engineering from Texas A&M University (USA) and has over 16 years of experience in data visualization, storytelling, and analytics. She has consulted for top engineering, manufacturing, and consulting firms worldwide and has coached over 9,000 professionals and students from leading institutions like IITs, IIMs, and ISI.